

As the insurance industry likely tuned into the various impacts of Hurricane Ian’s devastating landfall, a few things should be apparent. All of which were highlighted leading up to Ian’s landfall. This BMS Re tropical update will quickly touch on all these five points.
Ian will have its place in history
Building codes work
Impacts would be wide and far beyond the landfall location
The rainfall would be impressive
Ian is not done yet
Ian will have a place in history
A book could be written on Ian’s place in history. However, let us focus on the stats that matter to the insurance industry. First, as we pointed out back on September 22 will be retired. After a twelve-year drought between Wilma in October 2005 and Harvey in August 2017 (over 12 years without a major hurricane landfall), Mother Nature is correcting the record. The U.S has now had six Category 4 and 5 landfalls since Harvey. In terms of wind speed, Ian ties for 5th with eight other U.S. landfalls since 1851 that have had winds of 150 mph. The September 3is still at the top with 185 mph winds. Interestingly, Ida, which occurred last year, was also a 150-mph hurricane at landfall. Pressure is historically a better measure, and when you use that metric, Ian is the 18th lowest pressure with a reading of 940 mb, which is tied at the 18th spot on the list with four other storms. Again, the Labor Day hurricane is at the top with a pressure of 892 mb. However, these stats can change, as we saw with Michael 2018, which post-landfall was upgraded to a Category 5 hurricane. The overall best track intensities typically have an uncertainty of around +/- 10%.
It is remarkable, however, that Ian made landfall in almost the same location as Charley (2004). Charley had winds of 150 mph with a pressure of 940 mb. But, as discussed yesterday, that is about the only similarity between the two storms, along with the likelihood that Charley had a significant influence on damage in some parts of Ian’s path.
Building codes work
You likely saw some media coverage from Ian, and in all the coverage, it was hard not to notice all the metal roofs that look relatively intact. Even images of asphalt single roofs look to be ok at first glance. As the last several BMS Re tropical updates mentioned, Charley and Irma and some other litigious issues across Florida, have forced many structures across south Florida to be modernized with new roofs and other updated codes.
In fact, world-renowned storm chaser, Josh Morgerman (@iCyclone), who has been in the most destructive storms on earth, commented, “One thing I have noticed is newer houses, which were built after the devastating Hurricane Charley (2004), it looked like those houses performed very well. It looks like if you build the right stuff, stay up.” He was chasing in Punta Gorda, ground zero for Ian’s landfall.
https://twitter.com/iCyclone/s...
Now sometimes, the devil is in the details. This could complicate the claims process as structures will need to be thoroughly examined, and of course, a structure is only as strong as its weakest point. The roof might be fine at first glance, but maybe some minor uplifting occurred, or perhaps the structure did not have impact and window and glass broke, causing other compounding damage effects.
In surfing social media for hours, one can find the expected pool enclosure and carport damage, which according to the Insurance Institute for Business & Home Safety, is almost entirely preventable damage. There does seem to be a high degree of widespread manufactured home damage, which makes up 8.9% of the total housing stock across the state, according to the U.S. Census Bureau. Specifically, this area has a much higher concentration in inland counties such as Highland, Polk counties, which also received damaging winds and less widespread media attention.
Disaster by design likely caused the worst flood event in Florida history
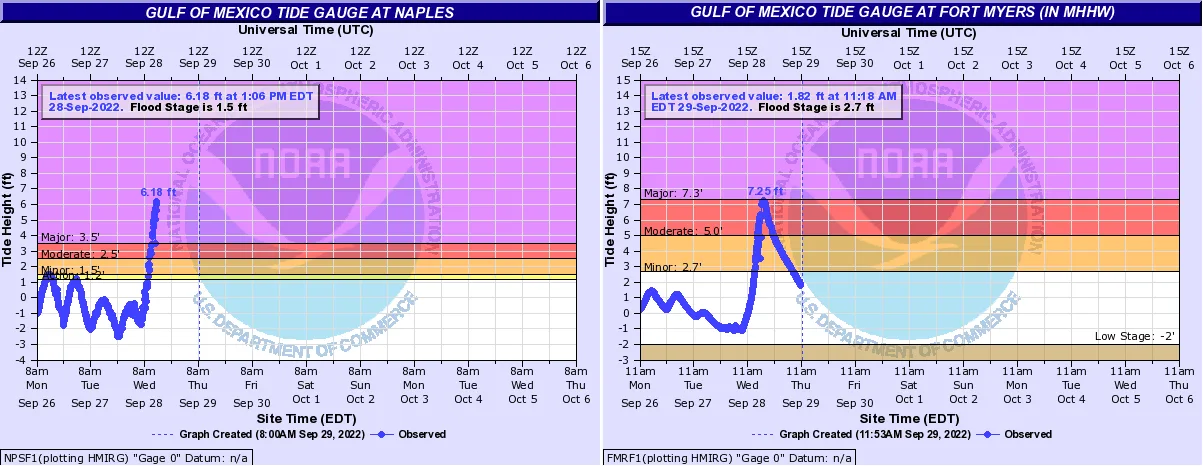
Disaster by design is worldwide, and one of the better examples is parts of the Florida coastline. Yesterday, an image of the Cape Coral area, the Venice of Florida, likely received at least 10 feet of coastal flooding. Up Caloosahatchee River, the tide gauge at Fort Myers, Florida, reached a record 7.25 ft of storm surge, which is 3.8 feet above the previous record set by tropical storm Keith in 1988.
According to FEMA and the Insurance Information Institute, the most significant number of claims from flood events was Katrina, with 168,256. The largest Florida impacting storm was Jeanne, with 31,486. Given the higher take-up rate of NFIP flood insurance, which is about 30% in the impacted counties, this will without a doubt be the most significant flood loss in Florida and could very well make it to the top 3 FEMA losses given the high level of coastal flooding and inland flooding that is occurring across the state.
Impacts will be wide and far beyond the landfall location
It stated that impacts from Ian would be felt far beyond the cone of uncertainty issued by the National Hurricane Center. Surfing social media might be a bad sign that there is no information about specific areas that likely received the worst storm surge and wind damage. This happens time and time again during disasters. Michael (2018) and its impacts on Mexico Beach and the Bolivar Peninsula after Ike (2008). It is expected that the coastal area from Fort Myers Beach down to Naples experienced the worst storm surge and the tide station appears to have gone offline.
In terms of power outages, according to poweroutage.us, as of 7 am CDT, 2.6 million customers are without power; with the understanding that Ian is still impacting the state, this number is likely to grow. But, the overall benchmark for outages was set during Irma at just over 6 million customers in Florida, so maybe that also provides an idea of total wind and damage impacts across the state. However, it should be noted that Irma impacted southeast Florida, which has a much larger population.
The BMS iVision, which uses the Verisk Respond package, now allows clients to see historical wind impacts using modeled and weather observation. It is interesting to see that the worst of the winds seem to be to the north of Ian’s track, which is a bit unusual for a named storm, as the strongest winds are typically on the right side of the track. This could be a result of dry air and limited convection to the south of Ian, with many of the heavy convective bands setting up to the north of the Ian path at landfall, which is also precisely the location of the heaviest rains. The National Weather Service has a detailed listing of wind reports that can be found via the public information statement. The other compounding effect, will be the prolonged winds, as Ian was moving at 8 mph at landfall and took several hours to cross the landfall region.


Overall, some very large insurance industry loss numbers have been published across various insurance publications. Estimating losses from complex events like Ian in Florida will take time and years to develop. The various catastrophe risk modeling companies have made many enhancements to their modeling software over the year to get the answers right. This event will show if their research and adjustments have helped. BMS Re is currently undertaking a hurricane model loss performance study using recent hurricanes. The initial results from this study suggest that catastrophe models generally underestimate insured losses. Still, it should be noted that every insured portfolio has different risk characteristics and data details, making it difficult to just broad brush the entire industry. In addition, these models really are not meant to be used for catastrophe response; they are to be used to assess longer-term risk.
The rainfall will be impressive
It was mentioned that water was the new wind, and besides the coastal flooding, which has already been highlighted, the rainfall has been extensive. This might be one of the overlooked perils from Ian’s impacts. Radar estimates and surface observations suggest some areas have received up to 20 inches of rain. According to the NOAA precipitation frequency atlas, even 15” of rain in 12 hours for the landfall location is equal to a 0.1 percent probability of occurrence in any given year. This roughly equates to a 1 in 1,000-year rain event. Multiple rivers are near or above major flood stage, and some have already broken records, like the Little Wekiva River in Seminole County.

Ian is not done yet
Ian has not crossed Florida and is forecasted to track over the warm waters of the Gulf Stream, which are currently about 84 degrees Fahrenheit. However, Ian is also seeing the effects of drier midlevel air and wind shear. Ian is expected to interact with the eastern U.S. trough, which forced it east across the state and provides better overall dynamics. In turn, this should allow for Ian to strengthen to near hurricane intensity as it approaches the South Carolina coastline. Hence, a hurricane watch is issued for this section of the southeast coast.

Overall, impacts should be minimal, but coastal flooding could be an issue again as Charleston is very prone to that. Any wind damage should also be minimal, but still additive to the insurance industry loss that has already occurred. Once Ian makes its second landfall along the southeast coast, Ian dissipates and goes into the history book.