2023 U.S. Weather Extremes Summary in Charts and Maps
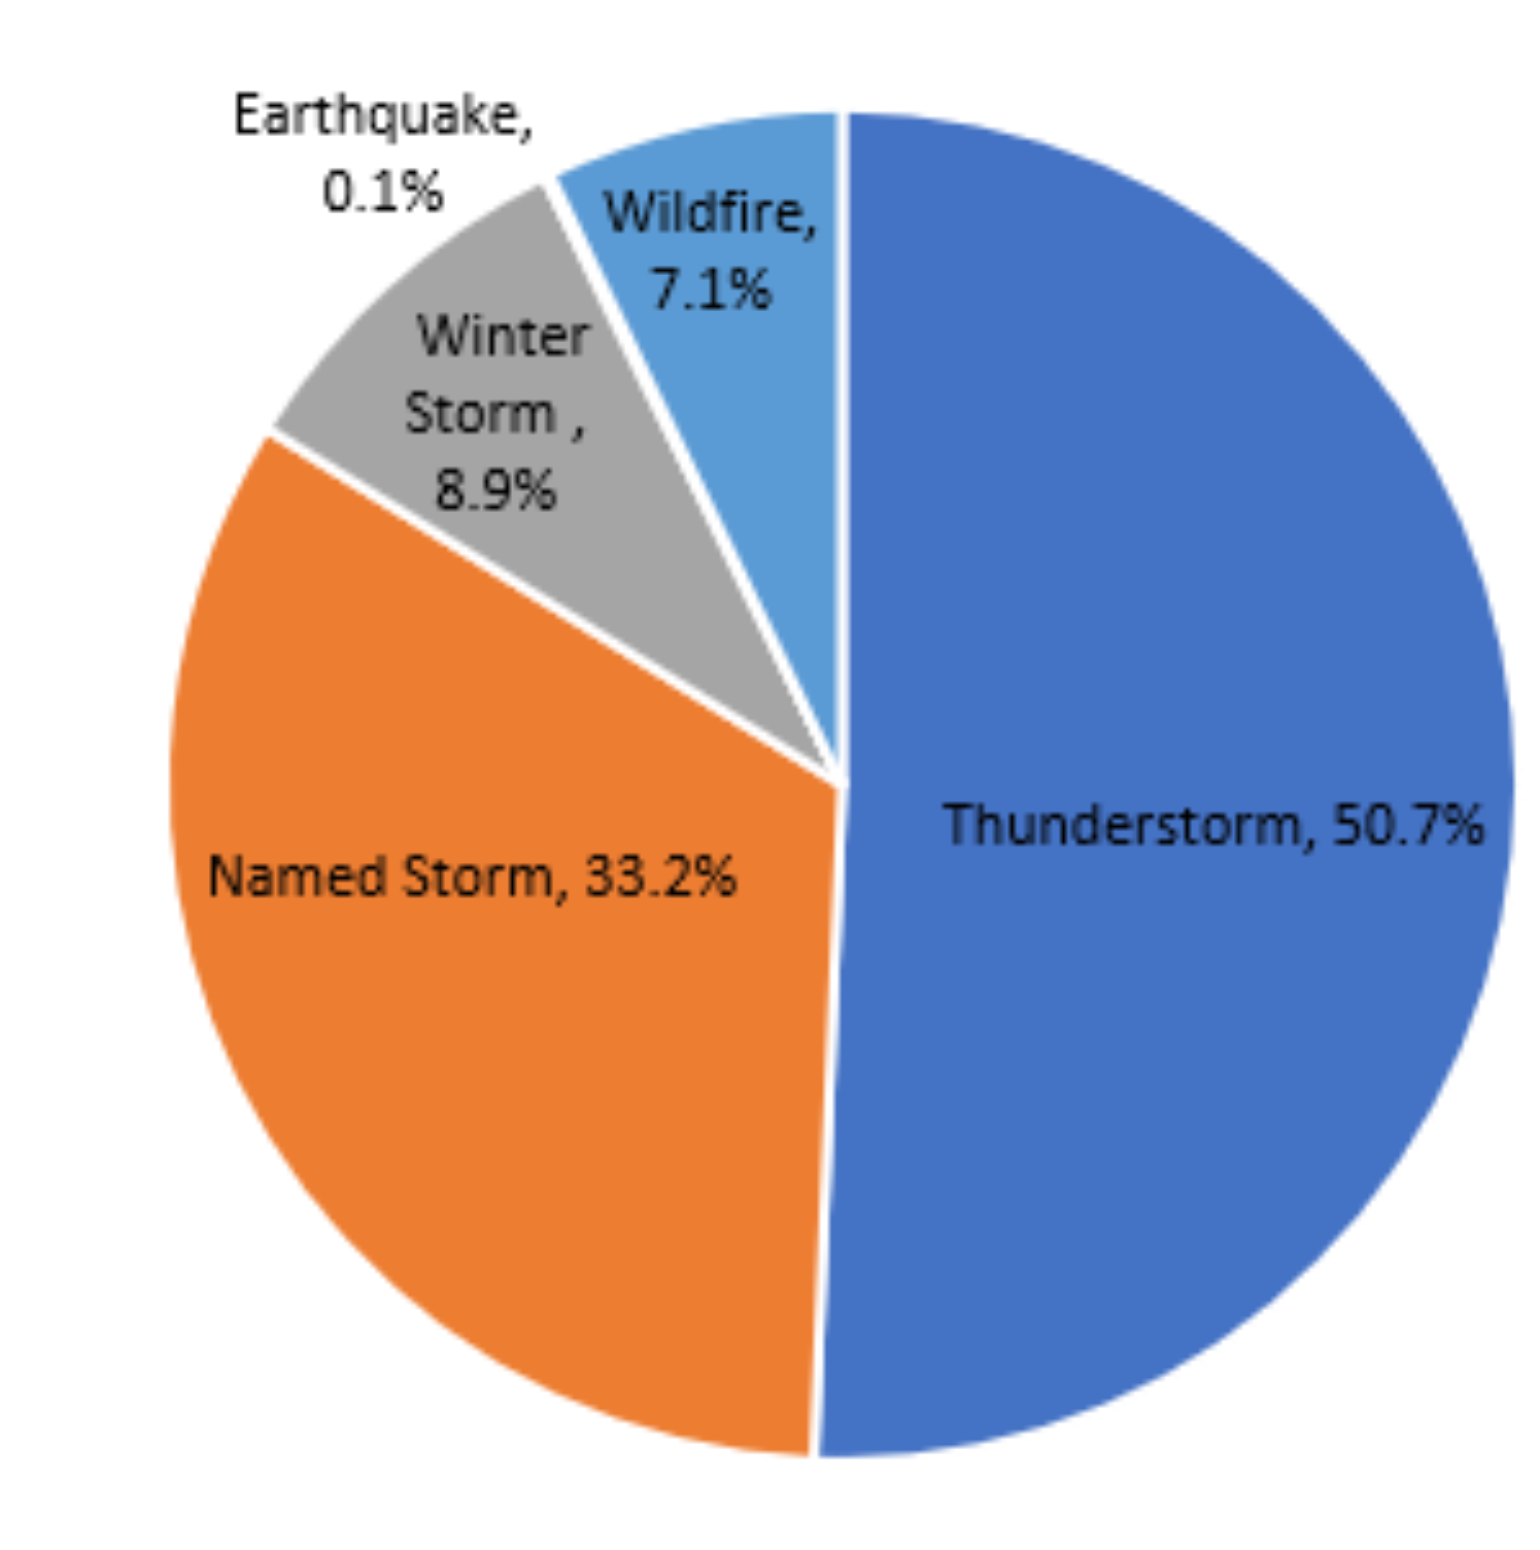
With only a handful of days left in 2023, we can now summarize U.S. weather extremes that impacted the insurance industry this past year in some charts and maps. In summary, U.S. weather extremes were very normal despite what one might have seen over mass media or how they might have played out on individual insurance company results, which we know can have influence far beyond the weather extremes themselves. This is why it is important to examine the weather objectively in this 2023 review by looking at perils in their totality.
Insurance Industry Losses
U.S. insurance losses tend to drive 64% of the worldwide overall insurance industry losses experienced in any given year. This year, worldwide insurance industry losses should end up below the expected modeled average annual loss suggested by Verisk Annual Global Modeled Catastrophe Losses of $133B. Although there is still some loss development from recent severe weather events from around the world, like the recent severe weather and flooding in Australia and Argentina and winter storms here in the U.S., overall, it would appear that the U.S. insurance industry losses will end up below $65B across all perils. This amount is just above normal at 108% above the 10-year average U.S. loss, but only 94% above the five-year average annual U.S. loss. In general, losses are fairly average, which might also accompany the views of various weather perils we highlight in this BMS Re Insight. Still, in any given year, there appears to be perils that dominate as the loss driver. It is clear that in 2023, U.S. severe weather was the driver of losses, which are just over double the 10-year average annual loss of $26B. These have resulted in a record year for severe weather losses across the U.S. and a pain point for many insurance companies. Thankfully for the insurance industry, the U.S. landfalling hurricane season in terms of losses was a snooze fest, compared to the last five years, when U.S. hurricane losses have been a major driver of overall worldwide loss. This year, there are still questions about how impactful Hurricane Idalia, which made landfall on August 30th as the season-only major hurricane landfall, will be on the industry, with many industry loss estimates suggesting a loss range between $1B and 3B. Still, the Florida Office of Insurance Regulation is reporting only a loss of $309M to date. Regardless, according to our analysis here at BMS Re, Idalia will likely be the lowest loss ever to have been experienced by the insurance industry for a hurricane of its magnitude. Using an insurance industry catastrophe model and the historical catalog of events, no landfalling event with a 105kt landfall or greater has resulted in a loss of less than $900M.
Temperatures
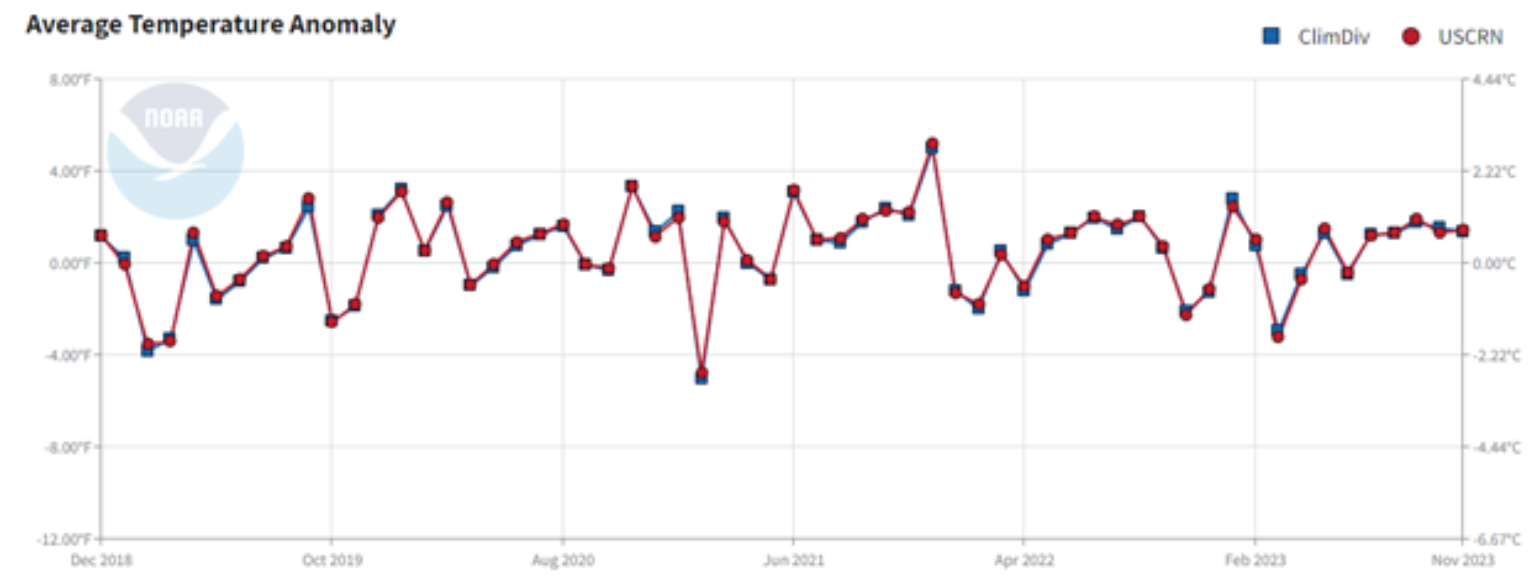
Although temperatures rarely directly impact insurance loss where cold temperatures like Winter Storm Uri (2021) have more impact than warmer temperatures, a lot of focus within the insurance industry media is around climate change and the direct or indirect influence it might have on extreme weather events worldwide. Worldwide global temperatures are at record high levels, which is typical during strong El Nino years like the one currently ongoing in the Central Pacific. As a result, 2023 is virtually certain to average more than 1.5 °C above our 1850-1900 baseline, which is above the Paris Agreement's ambitions to limit global warming to more than 1.5°C (2.7 °F) above the preindustrial baseline.
Over the last 11 months, temperatures across the U.S. have been running about 0.83°F above the 30-year average, with December being fairly warm across the contiguous U.S. overall. In fact, no single month was record-breaking, but regionally across the U.S., some areas could have seen record warmth.
Earthquake
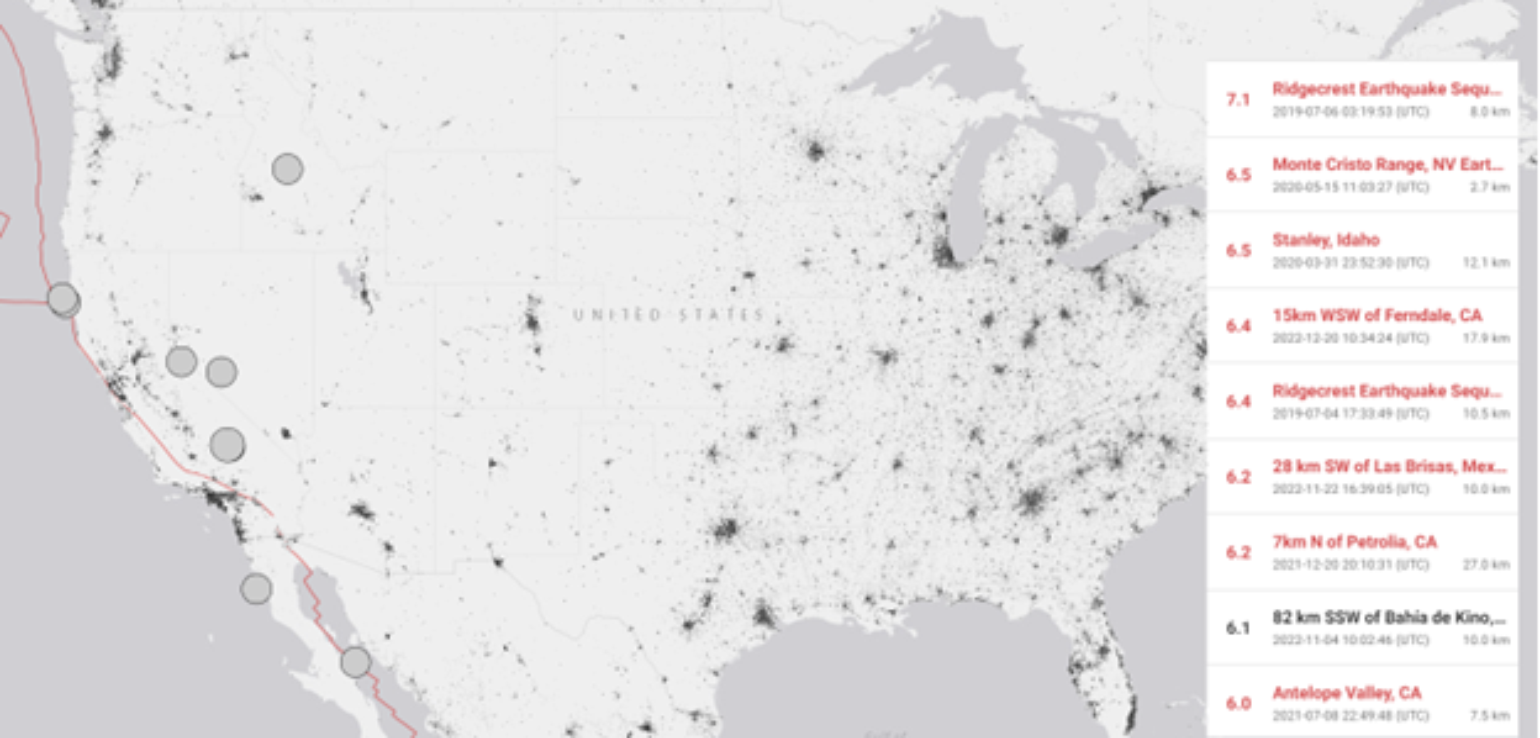
It is worth mentioning that the last significant earthquake loss for the U.S. insurance industry was the 1994 Northridge earthquake. Though 2023 is a reminder that it is not a matter of if, but when this sneaky peril will strike the U.S., just like they did in Turkey, Morocco, Afghanistan, China, and Nepal in 2023. Of course, like many perils, the impact on the industry is only felt if they occur in areas of high development with a high insurance take-up rate, which primarily did not occur in 2023.
Wildfire
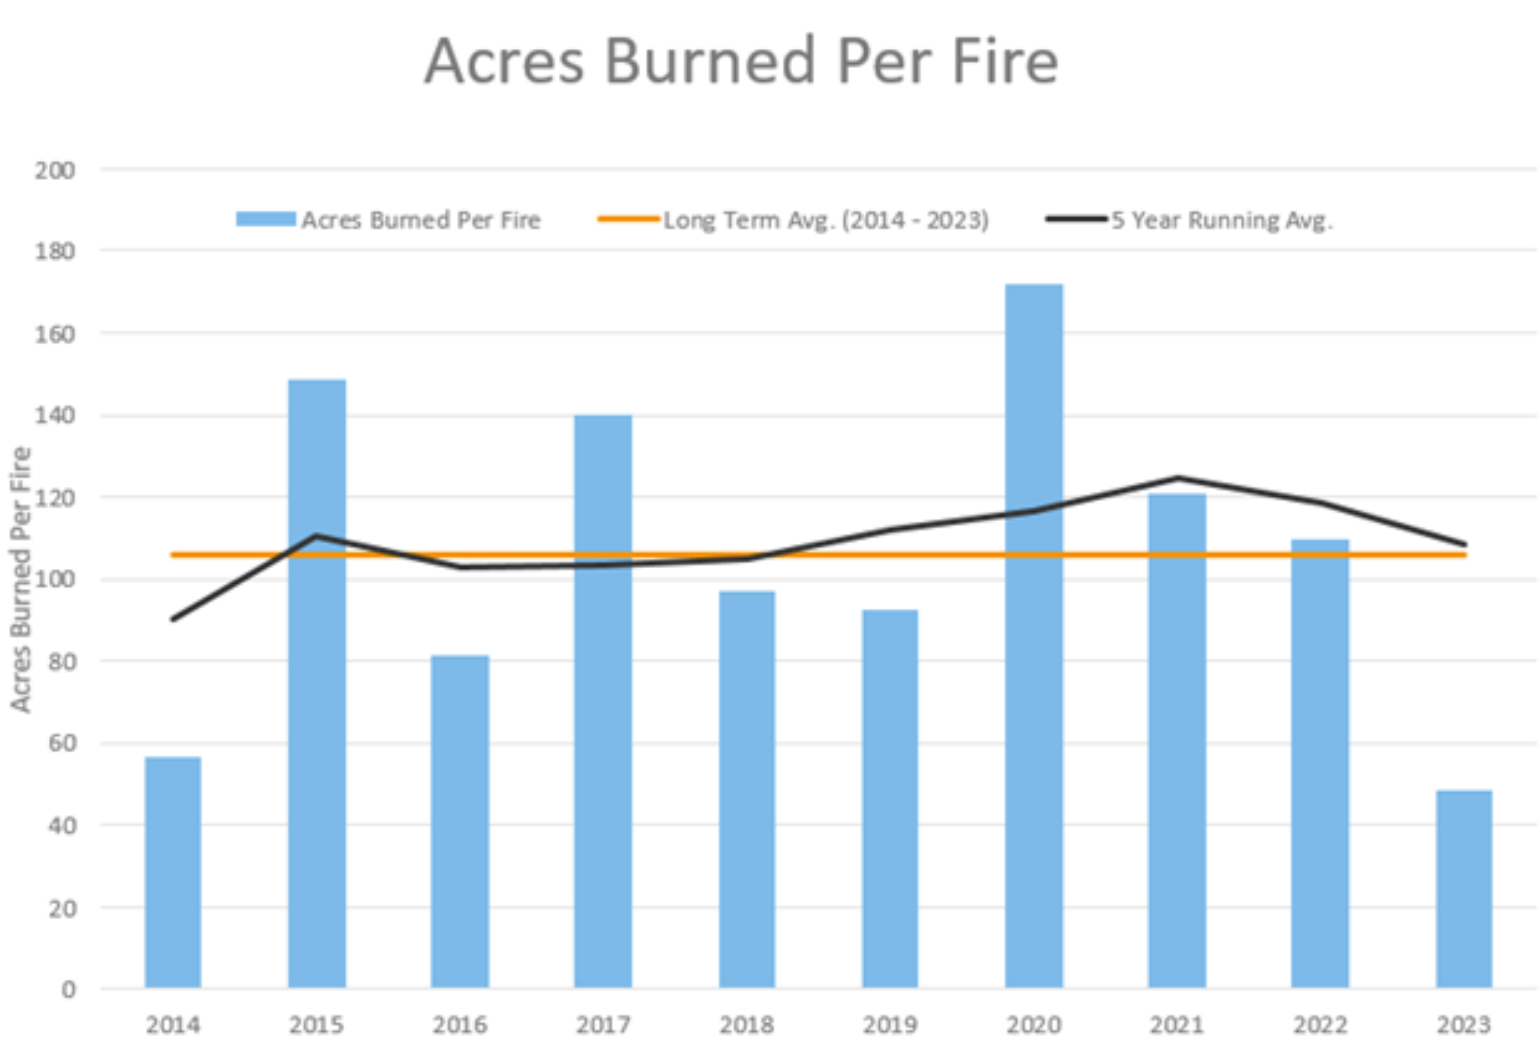
2023 proved that, once again, any area can be an extreme wildfire hazard area under the right conditions. The Lahaina, HI wildfire was one of only two U.S. major insurance industry loss events in 2023. The Lahaina fire caught the insurance industry by surprise. However, it was highlighted in our BMS Re summary that under the right conditions, the area could see high wildfire danger, which should not have been a surprise to the insurance industry. This fall, the southern states like Louisiana and the eastern U.S. saw several wildfires burning, typical during a dry fall period for the region. Besides Hawaii and a few fires in the Pacific Northwest, most of the wildfire attention was up in Canada, which made headlines by driving smoke over parts of the lower 48 states at times. However, this did not create any insured losses in the U.S. So, while Canada had a lot of wildfires, the U.S. had a below-average wildfire year, with the overall acres burned well below average, as shown in the chat below. This was likely a result of the much-needed moisture across the Western U.S that resulted in a drought-free California for the first time since September 2019.
Rainfall
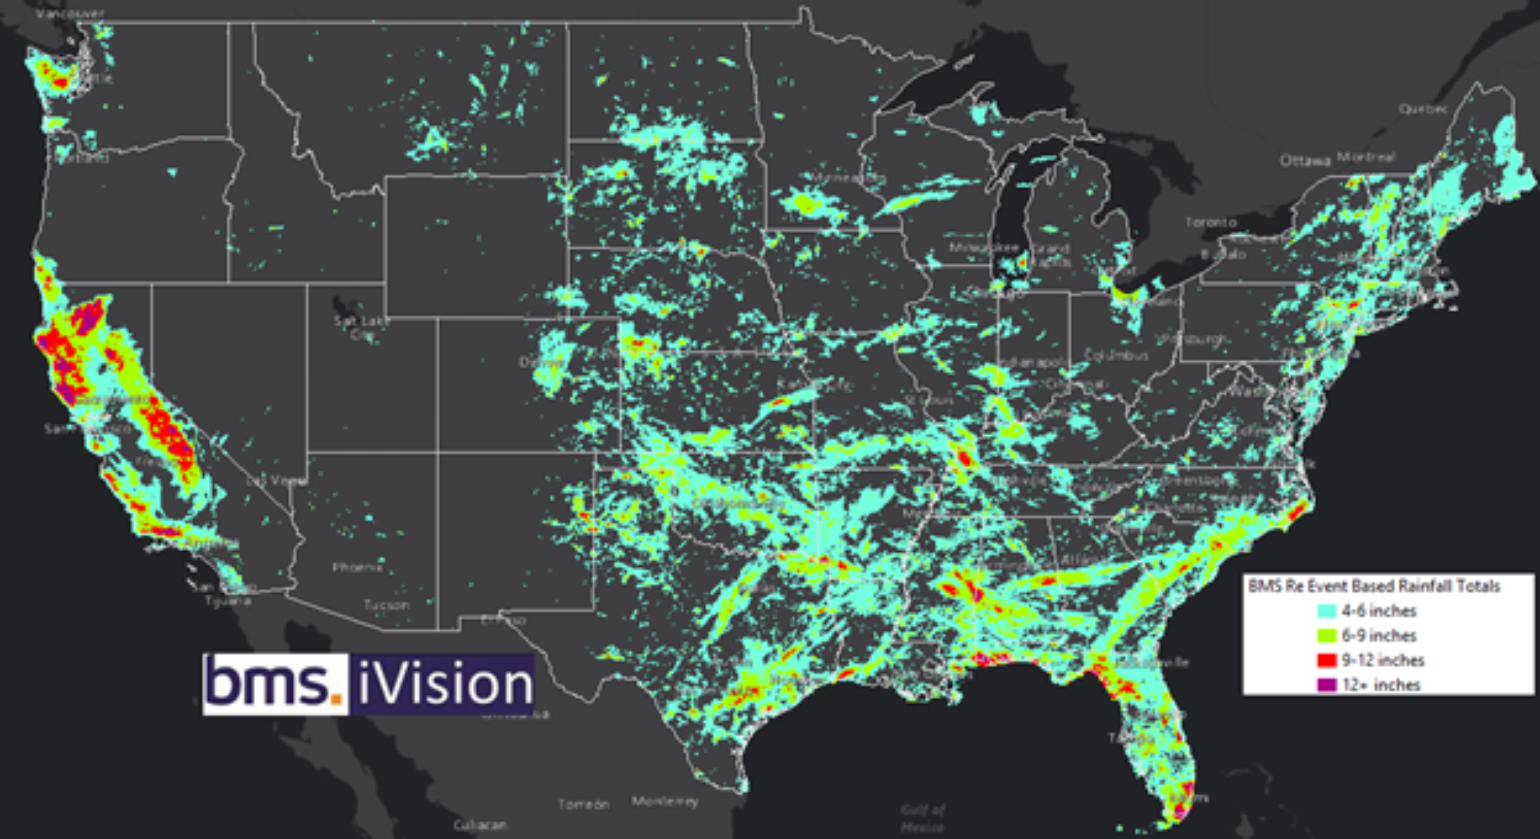
With a warming world, one should expect more extreme rainfall events as warmer air can hold more moisture. 2023 had several heavy rainfall events across the U.S., from the wet extreme rainfall that relieved the drought conditions in California and resulted in record snowfall to the historic flash flood event that occurred in Fort Lauderdale, Florida, and the surrounding areas on April 12, 2023. The Fort Lauderdale area reported 25.6 inches of rain within approximately 12 hours. Of course, the insurance industry just saw major rainfall in the Northeast in what was an unusual December rainfall event, resulting in major flooding for the areas. So overall, while the overall take-up rate of flood insurance is low, it is still growing across the private flood insurance industry. This means these major rain and flood events will likely have further reaching impacts than on personal and commercial line losses. Specifically, these heavy rain events typically impact infrastructure, making it harder for communities to and businesses to recover from such events. Our BMS iVision has aggregated Verisk Respond data to show major rainfall events associated with PCS loss events during 2023, as shown in the map below.
Atlantic Basin Named Storm
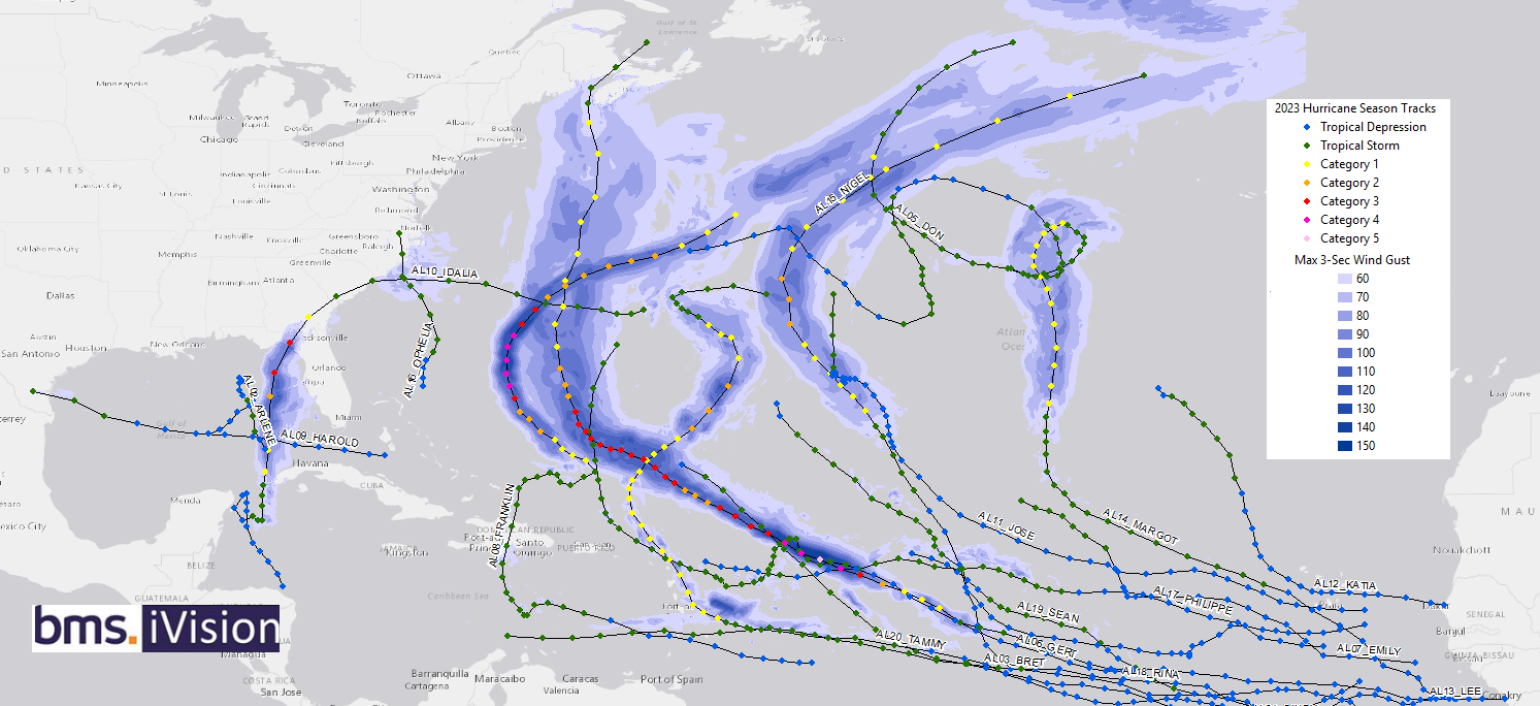
Like any named storm season, there are unique aspects and statistics. You can see our full BMS Re post on the 2023 Atlantic hurricane season here and the impacts on the insurance industry. There are a lot of interesting details, but as far as landfall and damage, the season had limited impacts on the insurance industry. In particular, only two hurricanes made landfall in the Atlantic basin: Category 3 Hurricane Idalia in Florida and Category 1 Hurricane Tammy in Barbuda. Florida did have a major event, but the industry will largely forget it in a few years as Idalia made landfall in a sparsely populated area and will likely result in an industry loss below $1B, but it should be a wake-up call for areas like Tampa that have now had two years in a row with a close call which would have been a game changer for he insurance industry after several years of large named storm losses.
Severe Weather Hail, Tornado, and Wind Damage
As highlighted earlier, 2023 was the year of severe weather impacts on the insurance industry, driving over $50B of insurance losses. However, what is particularly unusual is that overall, the measurements of severe weather observations were nothing record-breaking. In many aspects, they are on par with the expected long-term average for their respective perils. This suggests severe weather losses are much more complicated than just the occurrence of severe weather, and other factors could be driving the loss beyond where severe weather occurs. Recently, the IBHS held a webinar detailing how issues beyond record-breaking hail and tornado outbreaks are causing increasing losses in severe convective storm events. They demonstrated how IBHS research has delivered a deeper understanding of these loss drivers and identifies proven solutions to mitigate vulnerabilities through field and laboratory research. This starts with better asphalt shingles and how there is a movement with better building codes and products to reduce future severe storm losses. With that being said, losses are still being driven by replacing roofs that likely do not need to be replaced due to social actions within the roofing industry and policyholders. Below is the chart of the severe weather observations the National Weather Service collected from various severe weather perils. These methods have been consistent since 2005, which shows that 2023 is an average year across the perils of wind damage, large hail, and tornadoes.
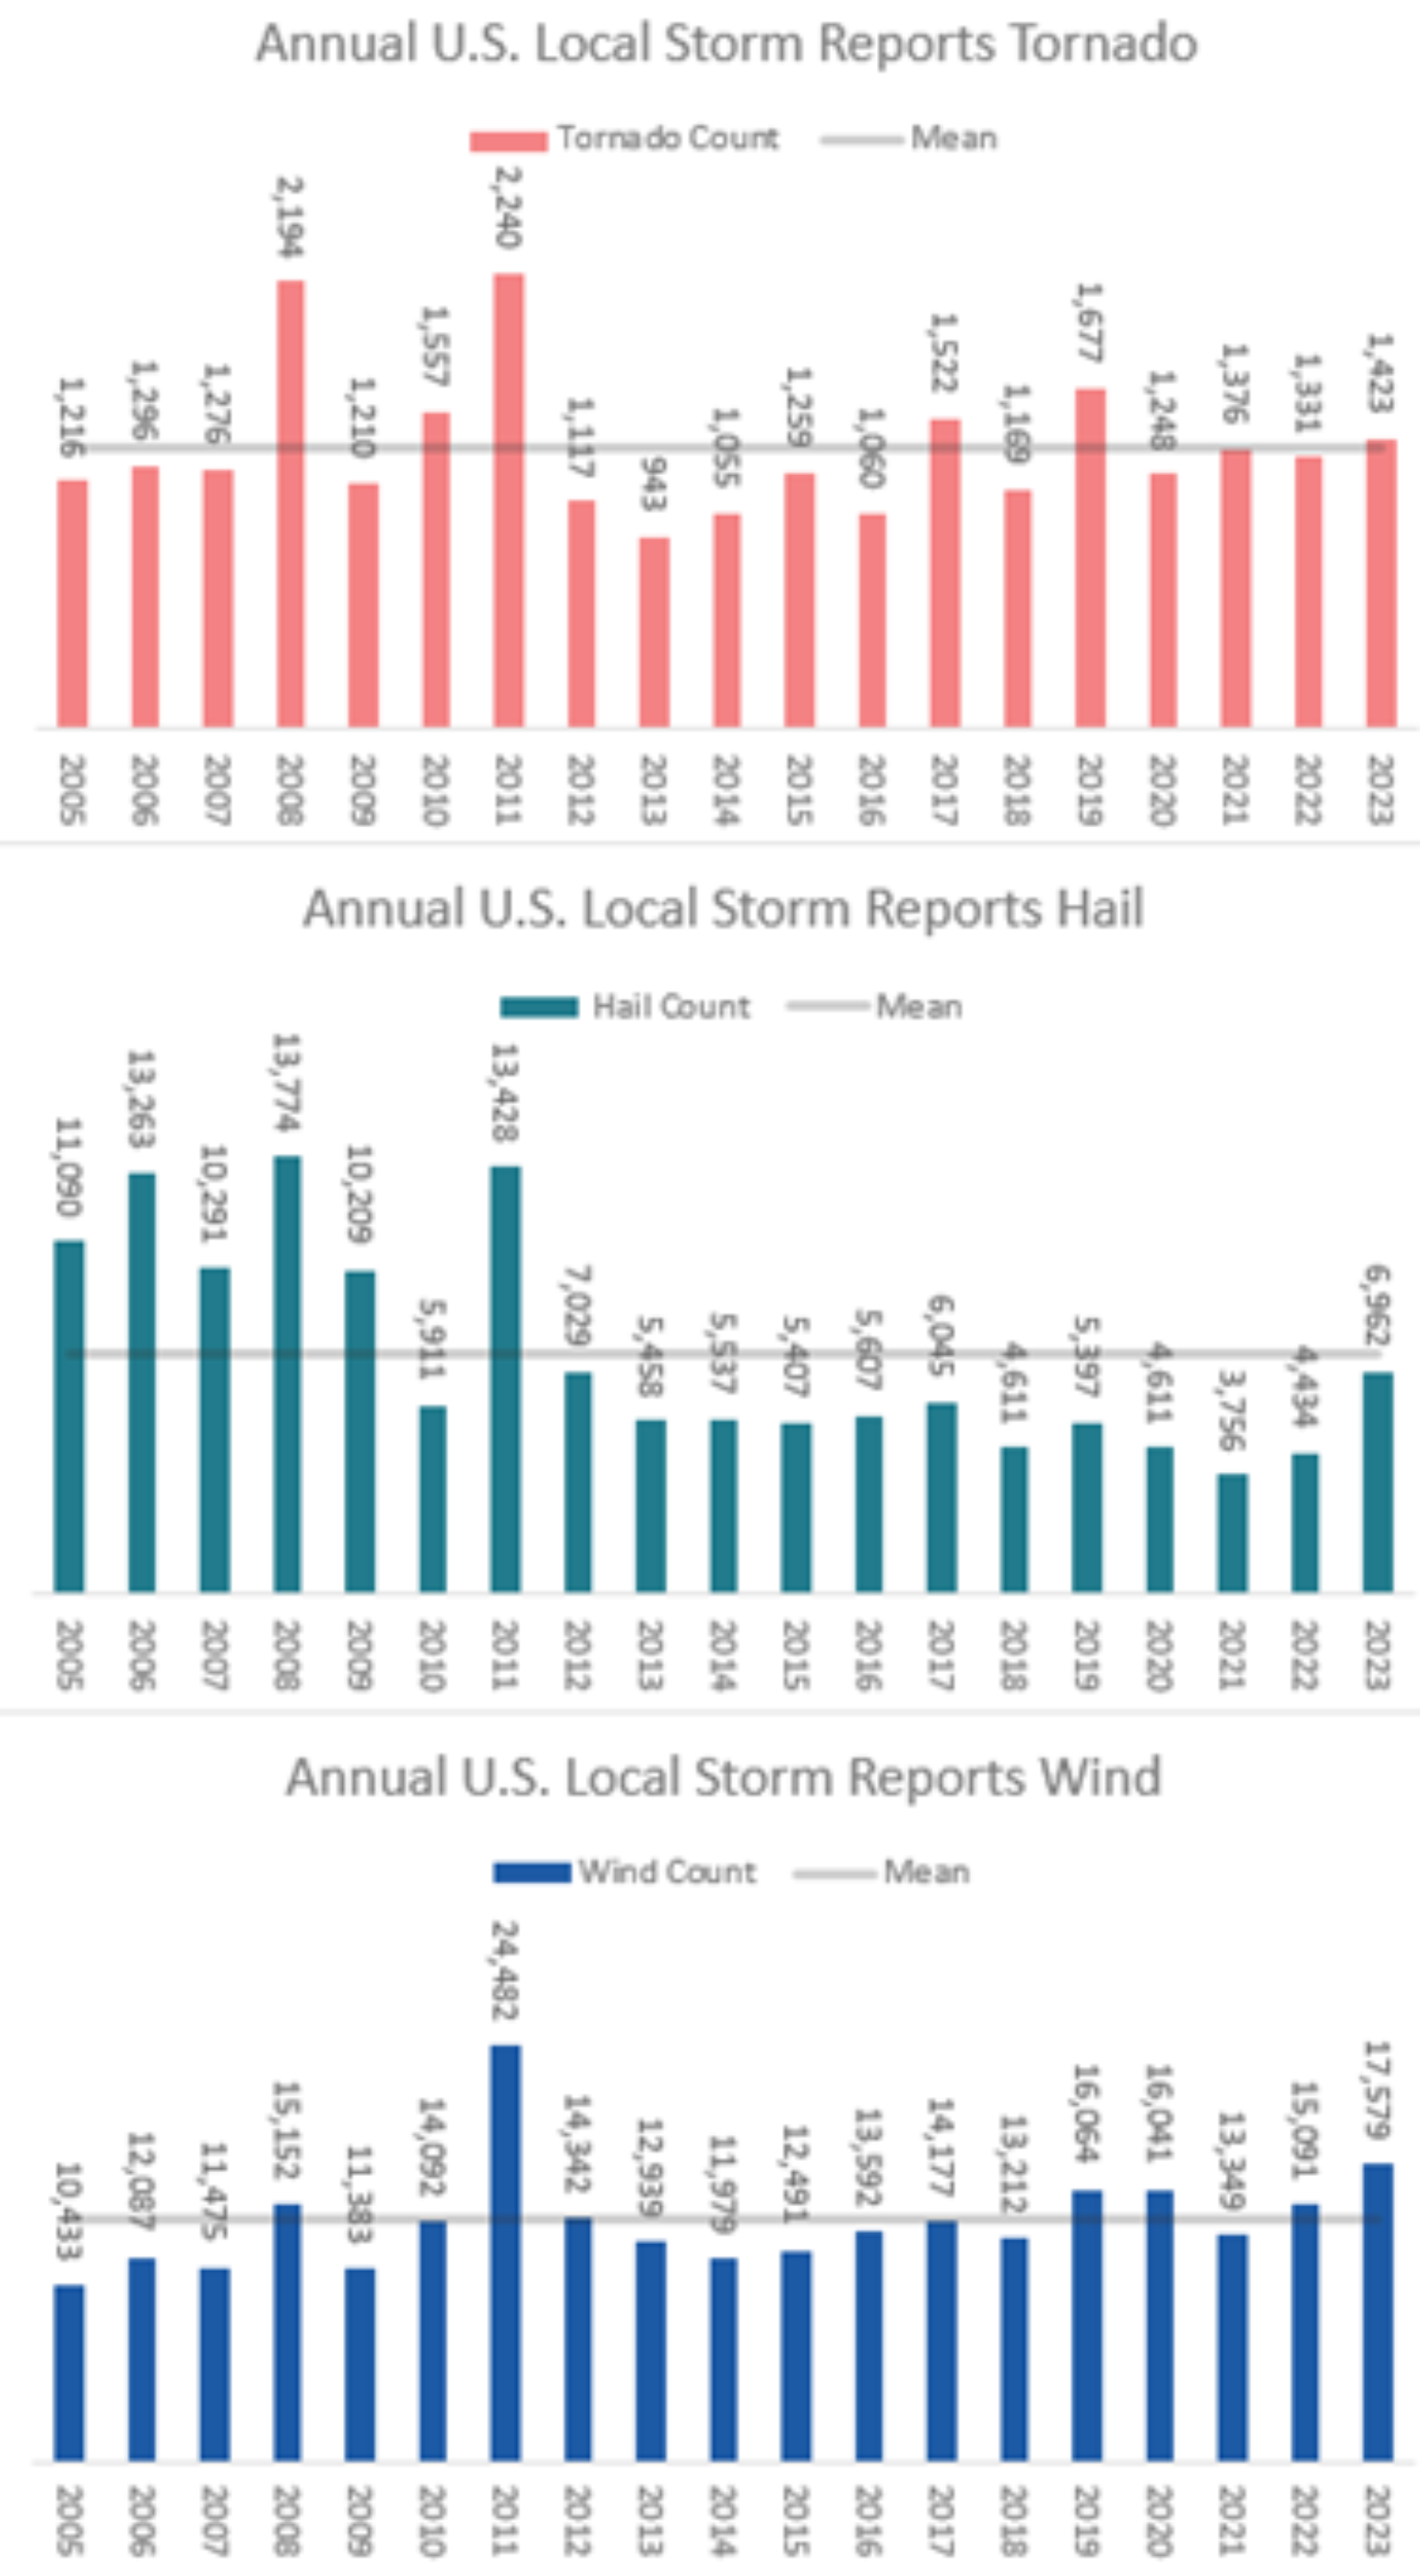
The figures above show tornadoes, hail, and wind-based on local storm reports counted with preliminary data for 2023. The data shows tornadoes are a bit above the recent average, and hail is below. Winds, in contrast, were exceptionally high in 2023 compared to the last several years. So maybe the losses in 2023 have more to do with wind-driven losses in combination with wind-driven hail driving up losses. The drivers could also be on where the severe weather was occurring. Below is a BMS iVision and our aggregate Verisk Respond data highlighting some troubled areas for hail over 1 inch and wind gusts over 60 mph.
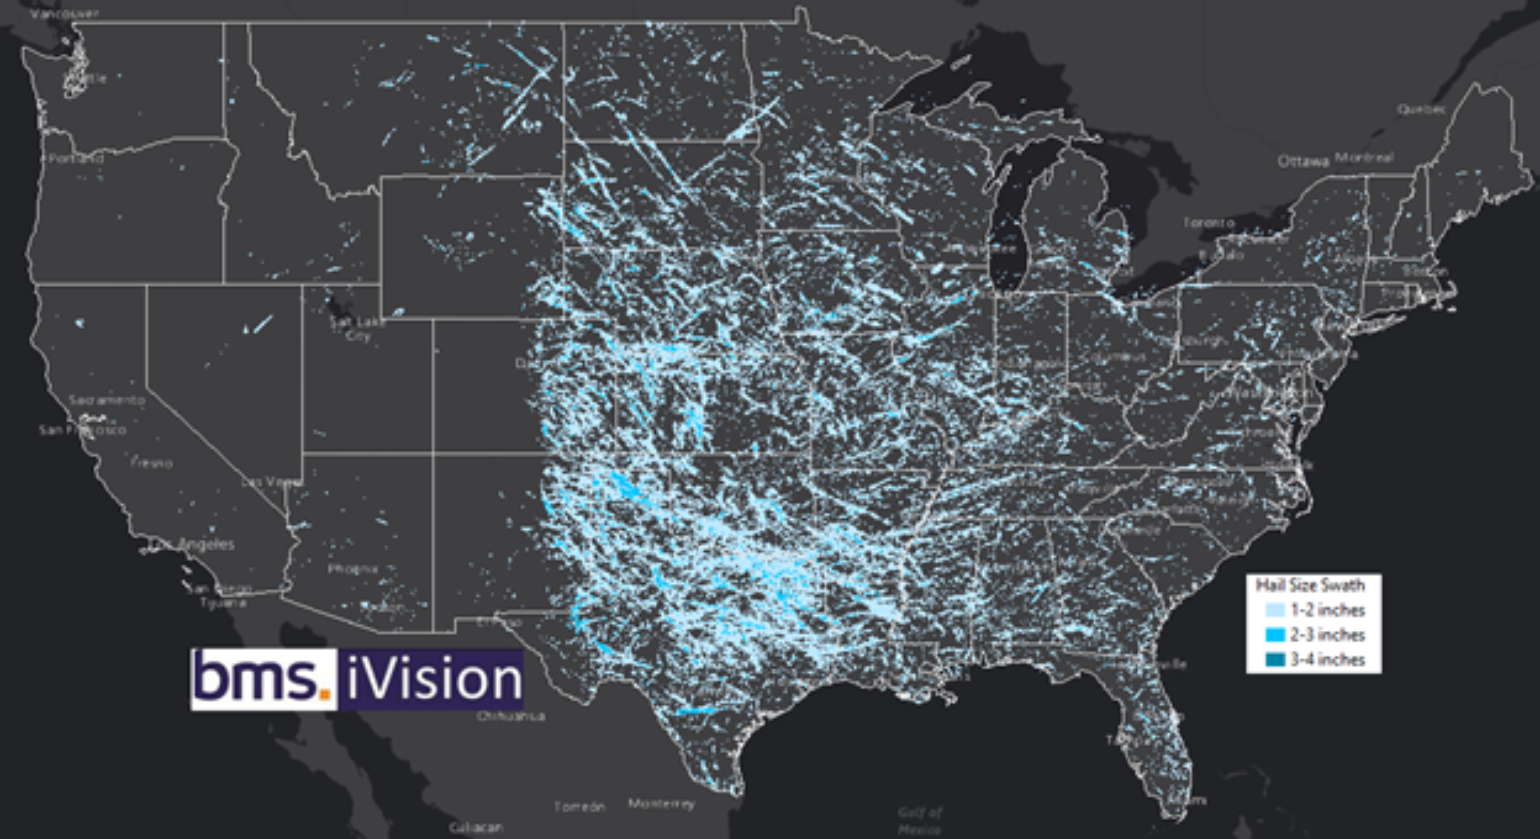
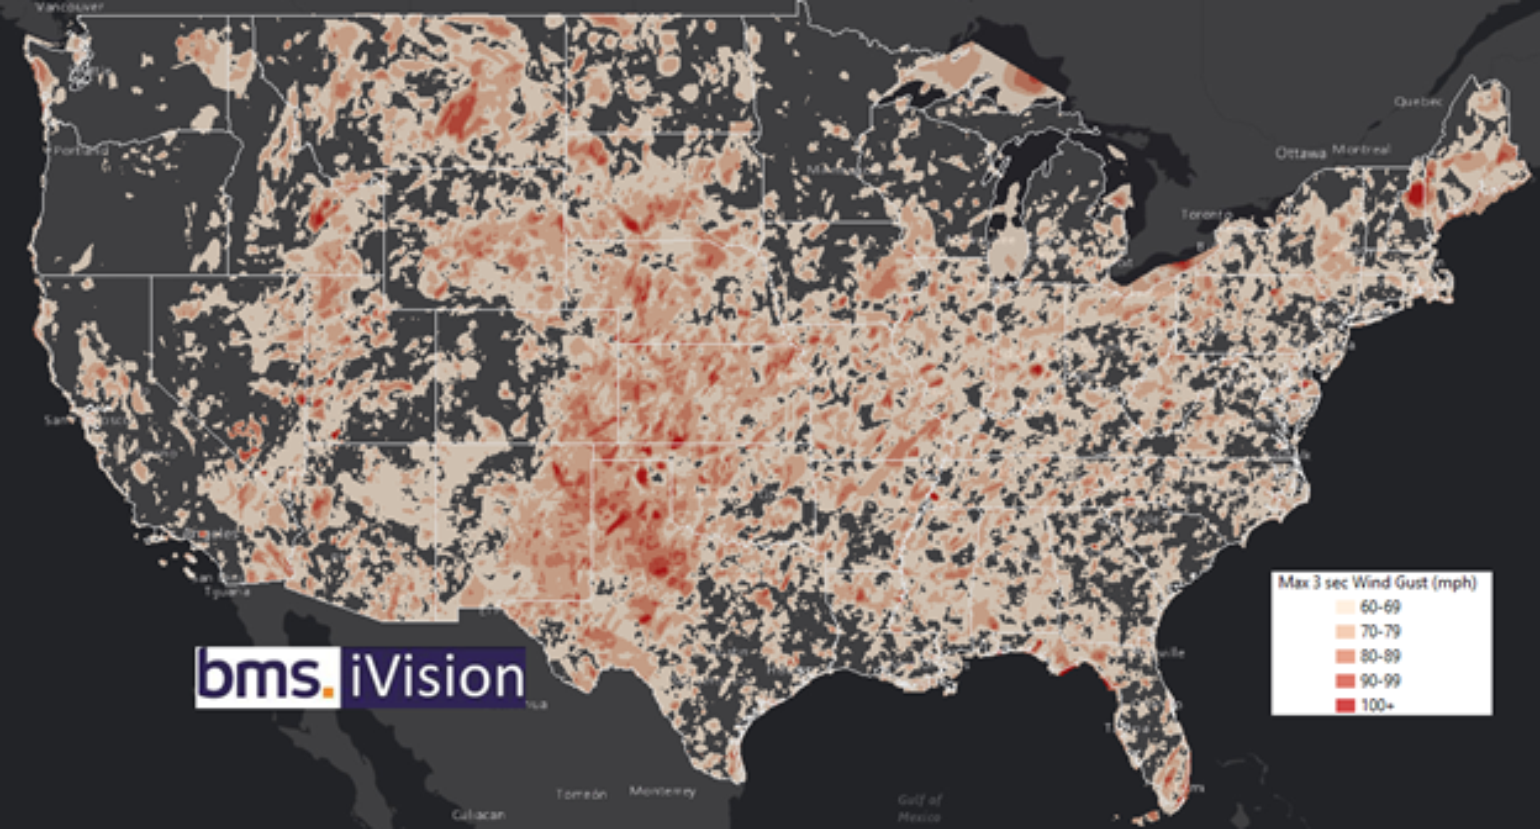
A lot of the country experienced at least one thunderstorm wind event over 60 mph, and combining that with hail events can be quite devastating in terms of total hail impacts. Some regional highlights are large amounts of hail and wind across Texas, such as areas along the I-35 corridor. Florida saw an unusual amount of hail. The front range of the Rockies also saw wind and hail events, which led to some costly events for the insurance industry. These BMS iVision PCS events will now be archived in our cat events module within BMS iVision, allowing clients to go back to 2012 to stress test severe weather events to better understand the maximum potential loss for their current inforce portfolio.
In summary, 2023 was an average year with below-normal insurance industry losses. 2024 will offer up its unique bingo card of events, so get it ready, as climate models already suggest that the severe weather season could be active in the southeast U.S this January, which is typical of El Nino winters. These climate models also suggest the central pacific El Nino could be short-lived, with some climate models suggesting a return to natural or even cooler La Nina conditions, which would aid in more named storm development in the Atlantic basin over the ground state of warmer SST.
In the new year, look for an update on what the 2024 bingo card might reveal in more detail. Thank you for reading, and have a wonderful New Year!
