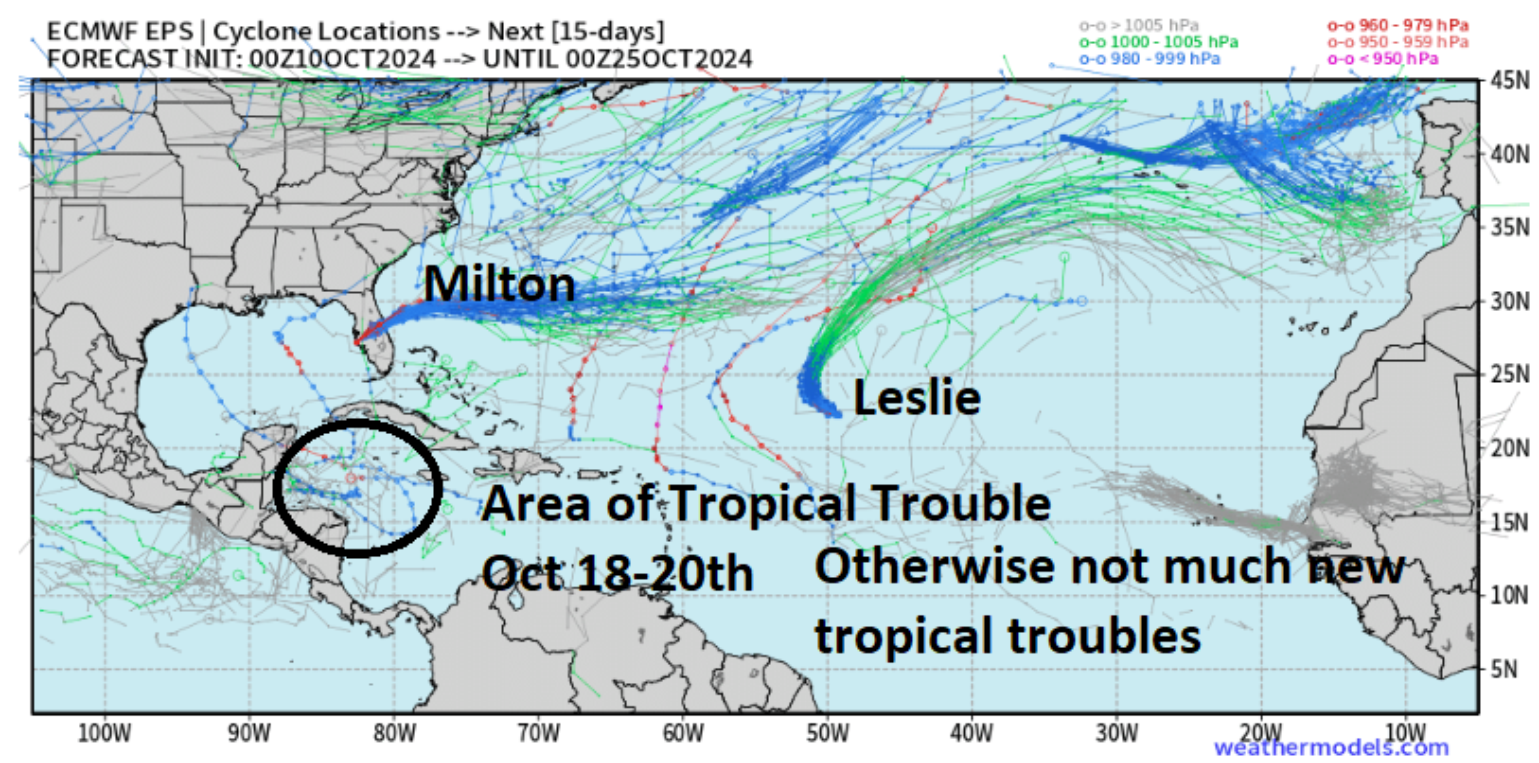
Milton Landfall Was Truly Historic
Hurricane Milton made landfall near Siesta Key in Sarasota, which is just 12 miles south of Long Boat Key, FL. This event will mark the 44th major hurricane to make landfall in Florida since 1851. Unfortunately, the folklore of hurricane missing Sarasota due to native American burial grounds is demystified. This was the first major hurricane to hit the Sarasota area directly since 1851. Other storms have narrowly missed the area to the north or south, with the closest being in 1859 and 1852. The other two that hit were close were in 1944 and 1946. Milton came ashore as a Category 3 hurricane with winds of 120 mph and a pressure of 954 mb. This is now the 5th Gulf Coast Hurricane landfall this year, three of which occurred in Florida alone. Milton marks the shortest span between two major hurricane landfalls in Florida since 1950, when Hurricane Easy and King struck 45 days apart. This is only the fourth time in history that two major storms have made landfall in the state. Notably, since 2017, there have been 10 major hurricanes along the Gulf Coast, a sharp contrast to the period from 2006 to 2017, when none made landfall—a remarkable shift.
As the damage assessments start to begin and as highlighted in detail in our BMS Tropical update yesterday, Tampa dodged a bullet. However, Milton is still likely the worst hurricane to impact the areas in decades, if not longer. This serves as a significant lesson for the insurance industry, highlighting what could have been as it grapples with these "Gray Swan" events that continue to challenge the sector. Hopefully, this near miss for the Tampa Bay Metro area brings greater awareness of the potential impacts if the winds had been stronger.
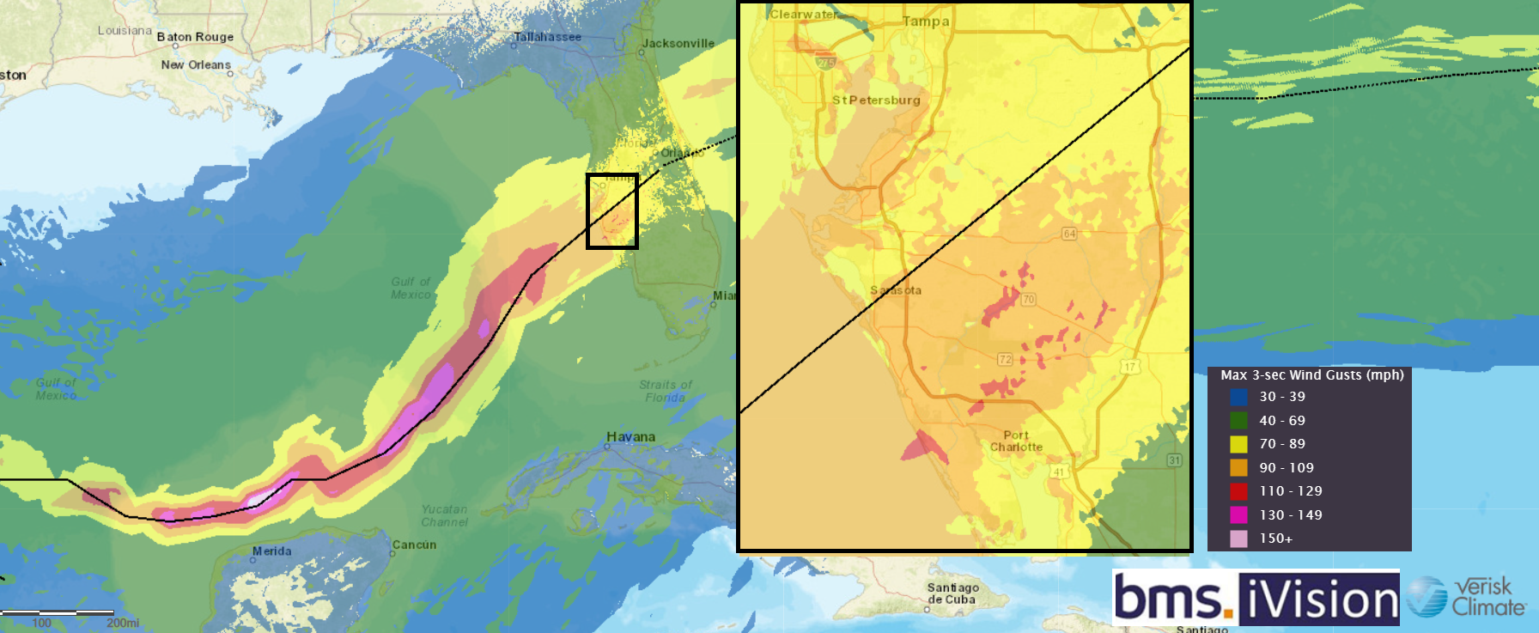
Although all observations are preliminary, it appears that some of the highest gusts that occurred were expected. Anna Maria Island had a wind gust of 106 mph. Sarasota airport went offline after having a wind gust of 102 mph. St Petersburg had a gust of 101 mph. Tampa Airport had a wind gust of 83 mph. Even inland, near Lakeland, there was a gust of wind of 76 mph. In fact, the highest wind gust occurred right up the populated I-4 corridor.
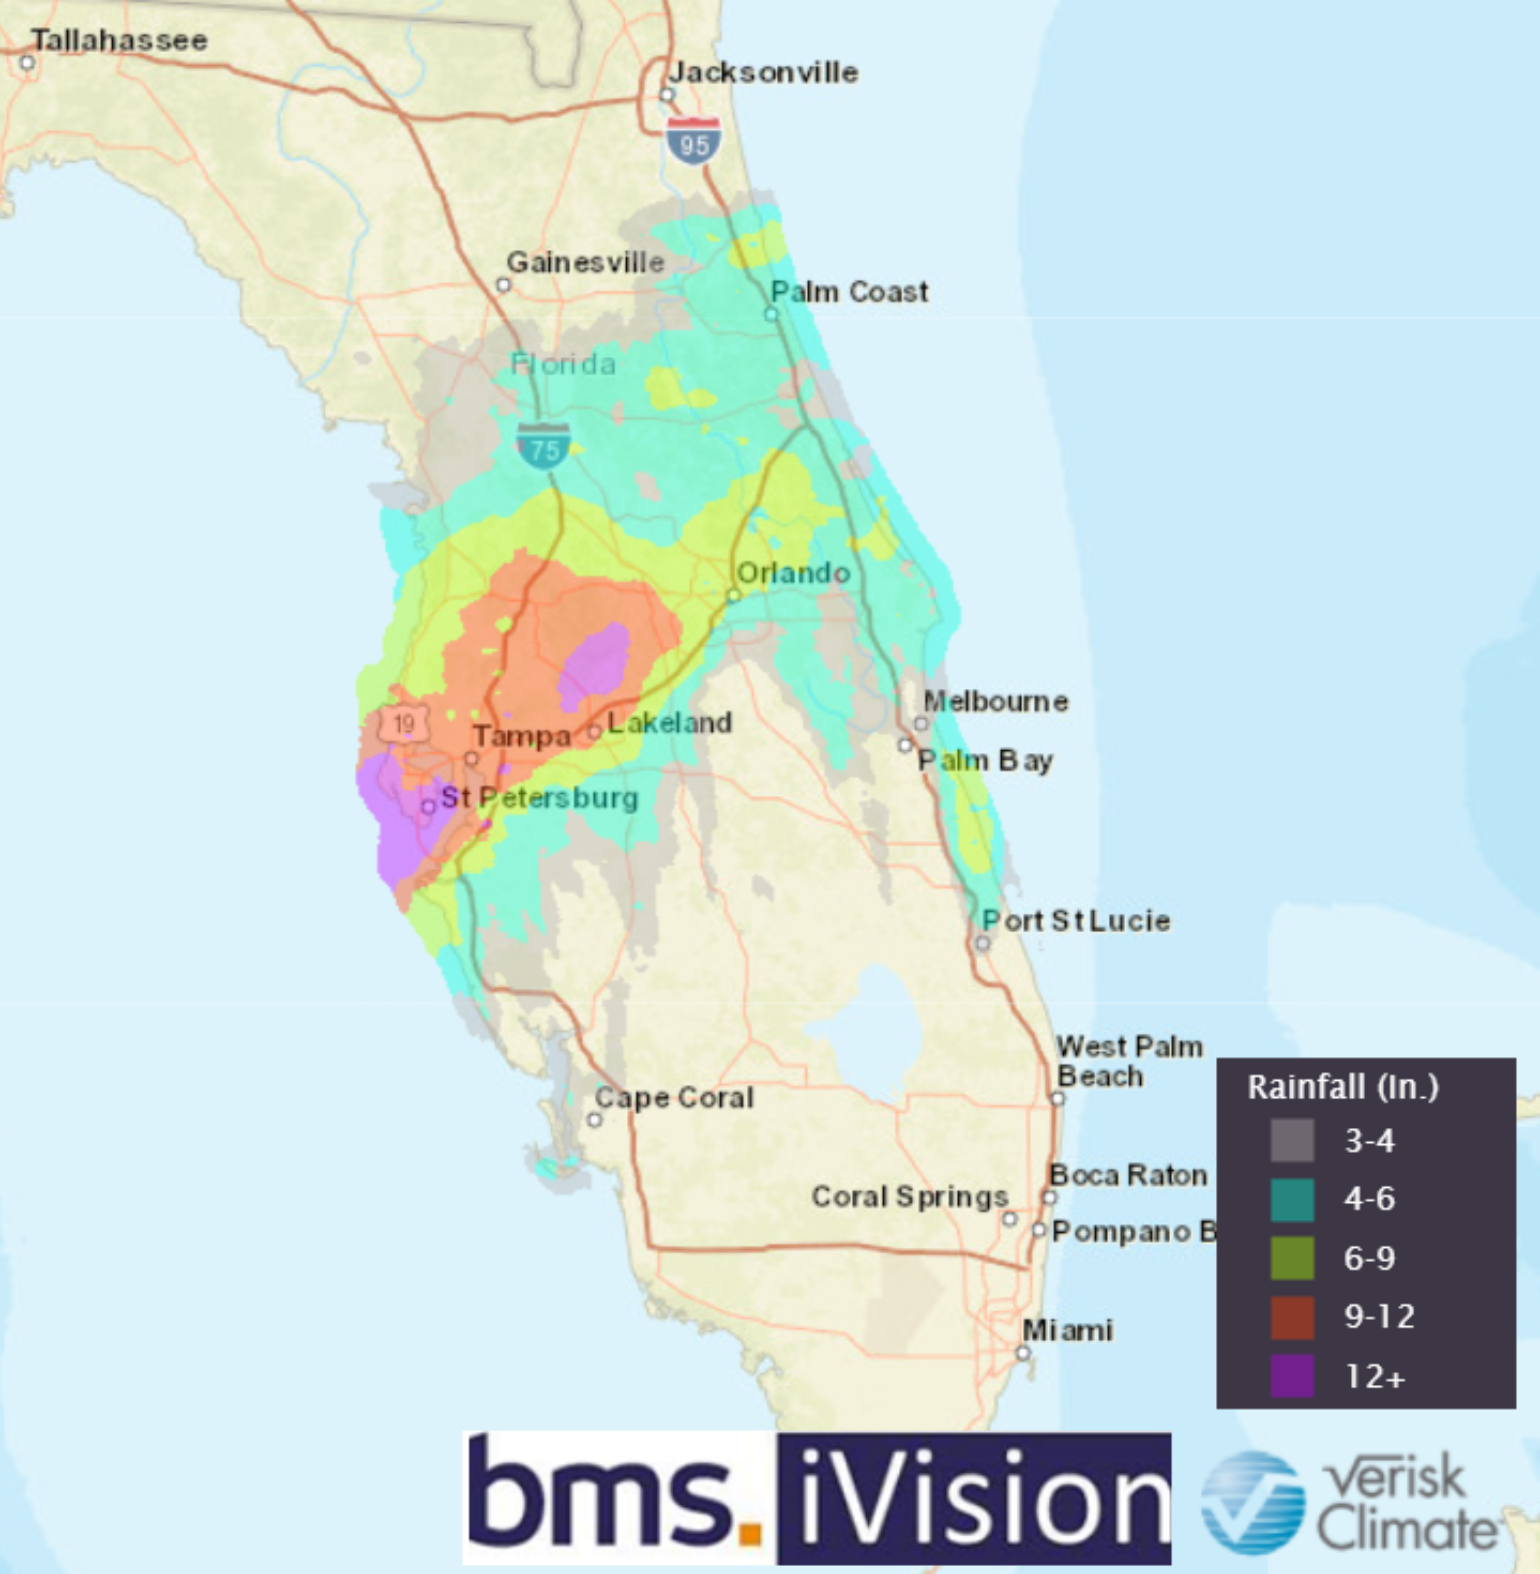
Besides the wind water once once again a big problem. Intense and prolonged heavy rainfall also occurred across a portion of the Florida Peninsula from the central-west coast through parts of interior central Florida to the central-east coast. Rainfall totals led to flash flooding in Pinellas and Hillsborough counties; parts of St. Petersburg received 18 inches of rain from Milton, with 11 inches reported in Tampa and 10 inches in nearby Clearwater Beach. However, the majority of the insurance indsutry loss should be wind related loss and not flood related or storm surge related. The heavy rain could result in some increase in wind driven rain related claims, but driving rains are fairly common in Florida.
Initial Damage Thoughts
The media and storm chasers generally do an excellent job focusing on the worst damage. In this case, there is a lot of attention surrounding the damage to the translucent Teflon-coated fiberglass roof of Tropicana Field and a fallen crane in St Petersburg FL. Neither of these are well-designed to withstand the strong winds of a hurricane. As we discussed in the last two BMS tropical updates, the wind design codes in Florida are the strongest in the nation. Milton’s wind was within the design limit of new structures if they followed the code. The good news is that although there is plenty of outdated buildings, some of the strongest winds were south of Tampa and into Sarasota, which has newer construction. The entire state has seen a roofing boom even before recent hurricanes like Ian and Irma, and according to the IBHS, a roof under 10 years of age should again perform much better in high winds like the ones observed in Milton. The insurance industry can use this year's hurricane to understand the outcome of Milton. As mentioned in our Tropical Update on September 11th, the Category 2 landfall of Hurricane Francine was a significant test for the insurance industry. With many new roofs and changes in policy terms like higher deductibles, losses appear to have been mitigated. Early insurance loss estimates are below $500 million for Hurricane Francine, which is remarkable given the impact of a Category 2 hurricane on an urban areas like New Orleans. Two weeks ago, with Helene, the damage in areas like Parry, FL, was limited due to “Build Back Better” incentives from last year's hurricane Idalia. Overall, there are big questions about how this event might impact the insurance industry, particularly inland up the populated I-4 corridor. There appear to be more power outages with Milton (3.4M customers) compared to that of Ian (2.7M). Power outages can provide a correlation to possible damage from a hurricane. So, there are big questions about how all this will play out regarding insurance industry loss. The “Gray Swan” big event is off the table, with Tampa being largely spared. However, there is still a lot of development and exposure along Milton's path. Now, the question is how severe the damage was beyond design codes and higher deductibles.
Tornado Damage
Yesterday, there was a significant tornado outbreak caused by Hurricane Milton. We often do not talk about the destruction these tornadoes can cause from named storms, but this year, we have seen several named storms and major tornado outbreaks make U.S. landfall. Hurricane Milton has so far produced 45+ preliminary tornado reports and 126 tornado warnings. When all is said and done, this could turn out to be one of the more significant events, especially as damage surveys account for additional tornadoes. It is certainly a major event for the state of Florida.
Here are your Top 5 most-prolific tornado-producing tropical cyclones. Hurricane Beryl already cracked the Top 5 earlier this year.
Hurricane Ivan 2004 (118 tornadoes)
Hurricane Beulah 1967 (115 tornadoes)
Hurricane Frances 2004 (103 tornadoes)
Hurricane Rita 2005 (97 tornadoes)
Hurricane Beryl 2024 (65 tornadoes)
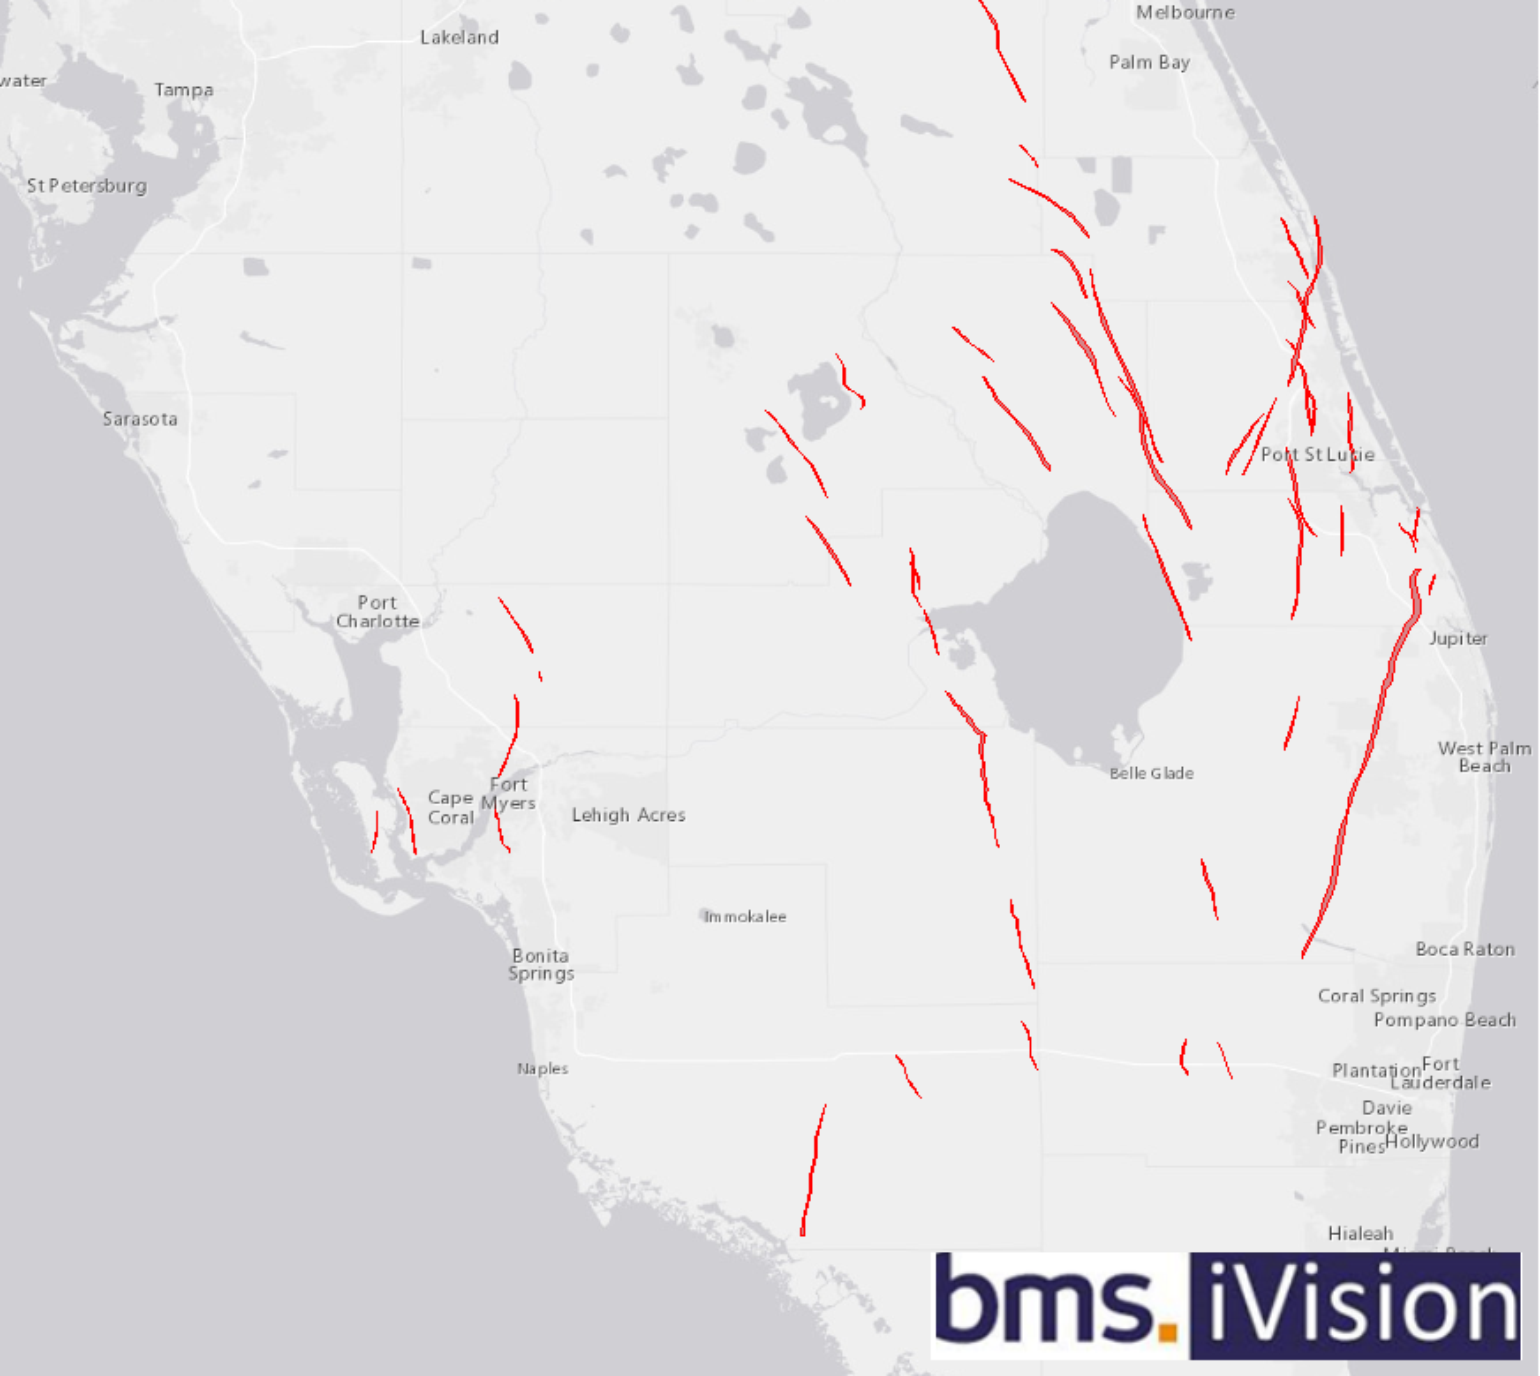
Another factor to consider with tornado damage is that buildings in Florida are generally built to higher standards. A tornado with the same rating that could destroy a structure in the Midwest might cause only limited damage in Florida. For instance, while it might not appear like it based on some of the damage photos from the tornado-impacted areas, these tornadoes could have been major tornadoes (EF3+). Nonetheless, tornado damage tends to be very localized and these tornadoes should not be a large driver of loss for the insurance industry.
More Topical Trouble?
Below is a look at our BMS iVision total wind swath product for the Atlantic basin. It illustrates just how active a landfalling season this has been for the insurance industry. Please note that some areas, such as those along the East Coast of the U.S., have also been left out which is welcome new for this section of the U.S. Coastline that hasn't seen a major hurricane North of Florida since Hurricane Fran 1996.
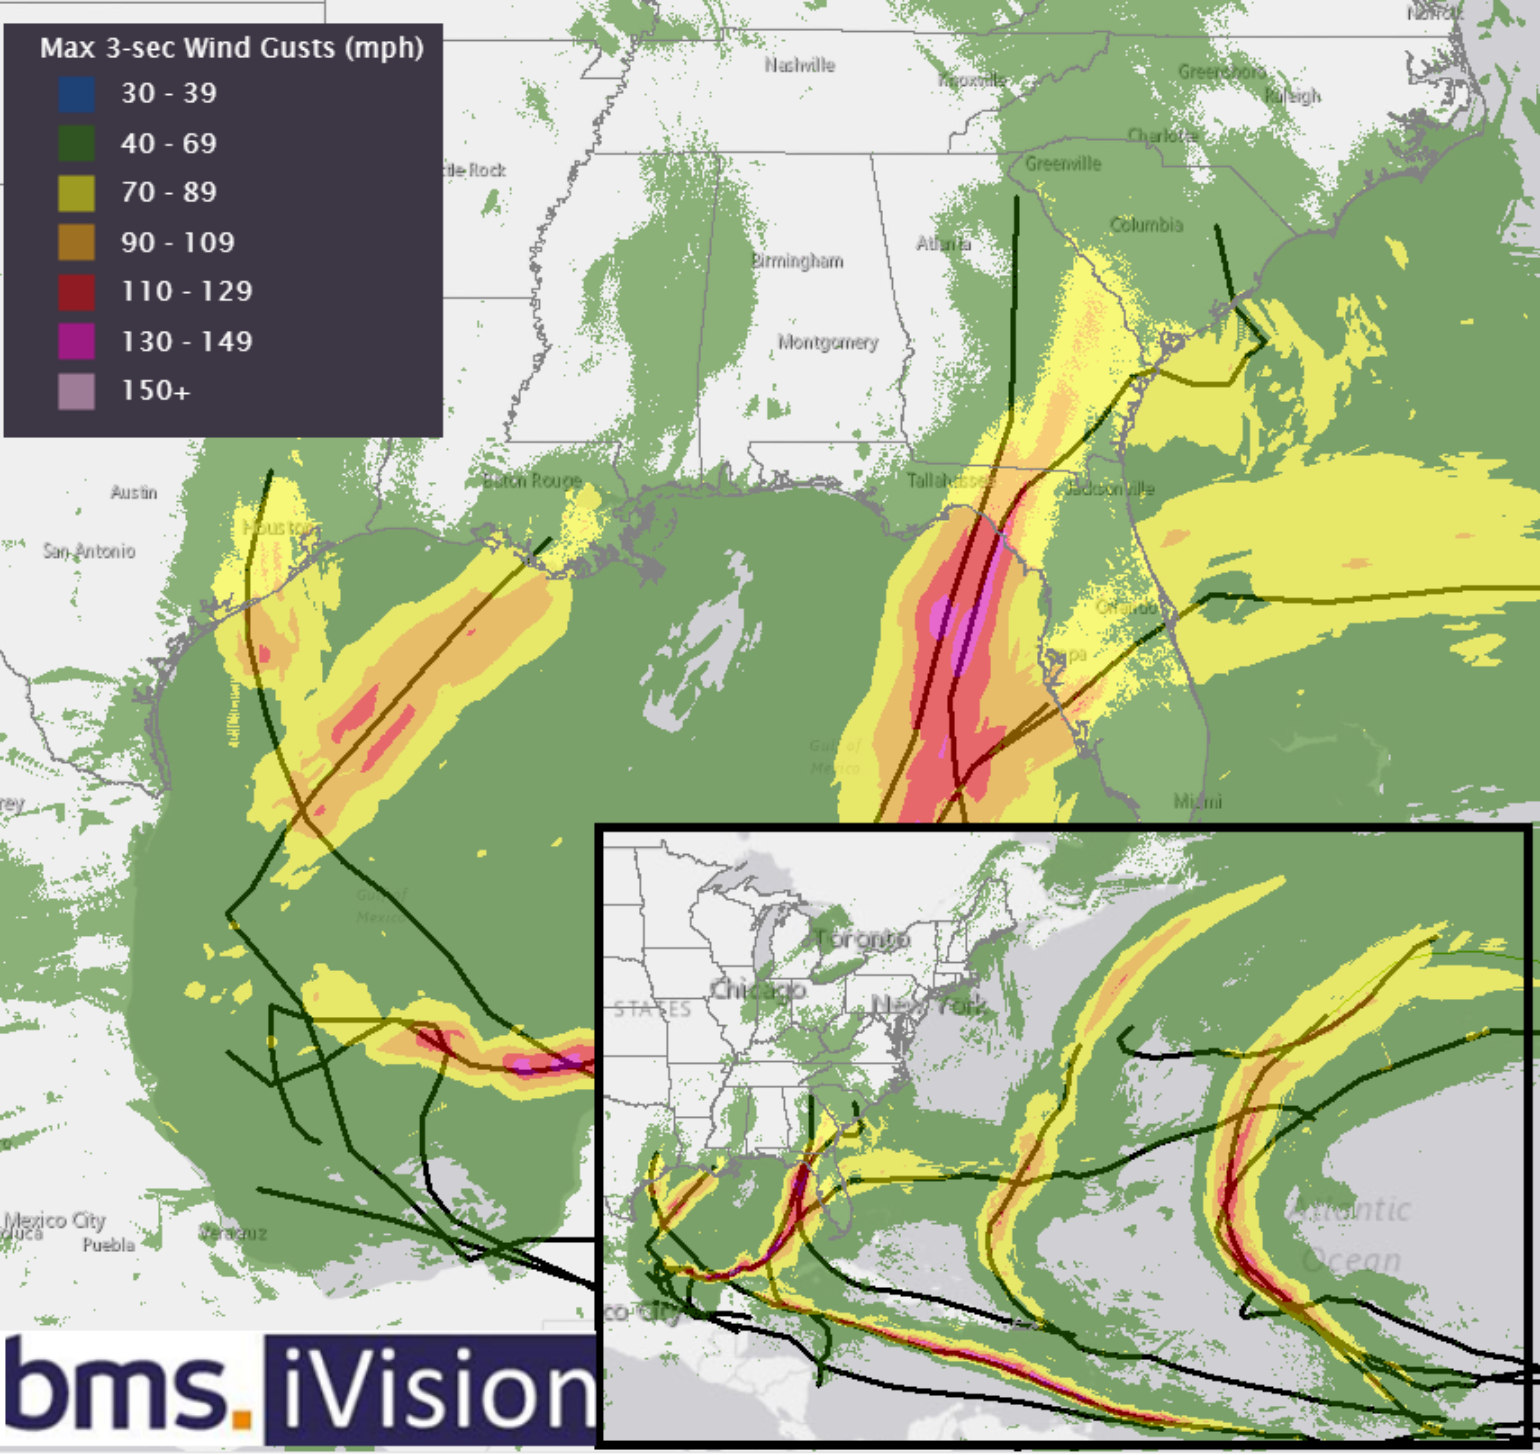
Hurricane season is not over yet; the peak lasts through October, with the season officially ending on November 30th. There are plenty of historical landfalling hurricanes at the end of October, such as Zeta (2020) and Sandy (2012). Even Nicole made landfall near Vero Beach, FL, more recently in 2022 on November 10th. The good news for the insurance industry is that one of the key indicators of increased Atlantic Basin activity, the Madden–Julian Oscillation (MJO), has been in a favorable phase for rising motion over the Atlantic. This is evident in the recent surge of activity since Hurricane Helene formed on September 24th. This MJO is going into a suppressed phase, which should bring large-scale sinking motion to the basin through the end of the month. However, this does not mean that tropical trouble cannot still form. There are hints that a tropical disturbance might form in the same areas as where Helene developed off the coast of Honduras around Oct 18th. However, whatever happens after that point is a guessing game. Still, the BMS Pathlight Analytics team is here to help understand what has occurred and might come and impact the insurance industry well before any suppresses occur.
