

No Dramatic Headline Needed
By now, you might have seen some eye-opening media headlines about the upcoming hurricane season: “Long-range forecasts suggest 2024 hurricane season from hell”. In fact, the industry-trusted source, Colorado State University, led by Dr. Philip Klotzbach, will not be issuing their forecast until April 4th. Even then, based on the April forecasts from CSU, they do not have the skill that the June or August forecasts have.

Although, it is too early to make the most educated guess on the very details of the seasonal forecast, it is not too early to provide a more general expectation of what this upcoming hurricane season will likely entail, which this BMS Tropical Update looks to do. Here, we look at the climate forcers that are often heavily weighted for hurricane season. By doing this, the insurance industry can start to get an idea of what to expect this season. Below, we examine the three primary factors that have typically given the insurance industry the best idea of how the season might unfold, and we look at what the climate models are suggesting, to potentially help with early track forecasts.
Atlantic Multi-decadal Oscillation (AMO):Since 1995, the North Atlantic basin has continued a sea surface temperature (SST) configuration that correlates with a more active period of named storm development. This is known as a positive AMO phase. This phase of warmer waters is thought to have a cycle of about 30 years. In fact, this positive phase made major industry news after the 2004 and 2005 hurricane seasons when risk modeling companies implemented near-term views of hurricane risk. That prediction did not transform into more landfalls as forecasted back in the mid to late 2000s. Still, since 2017, there has been no shortage of landfalls, which is running above the medium-term rate of expected landfalls. Overall, this positive AMO, now in its 29th year or so of being on the warm side, will not be going away this year. As a result, this climate forcer alone favors an above-average season.
The image below shows that the current Sea Surface Temperature (SST) is running where it should be in mid-May. In other words, it is already running hot. This will aid in any tropical development that does try to occur, but it should be noted that many more ingredients are needed for named storm development than just warm water.

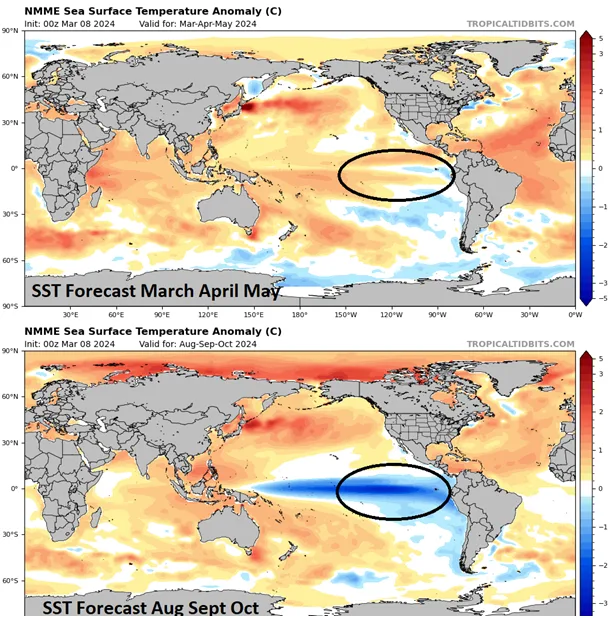
El Niño-Southern Oscillation (ENSO):Link. Currently, El Niño (warm waters in the central Pacific Ocean) is in the process of a rather brisk dissipation that looks probable to transition into the La Niña (Colder water in the central Pacific Ocean) phase of ENSO by the peak months of hurricane season (August through October). If this occurs, it also foreshadows a favorable atmospheric environment for increased named storm activity in the Atlantic basin as it will bring overall less wind shear, allowing for tropical convection to form easier.
Climatology: Now, we can look at the historical data to see how previous hurricane seasons match up with our expectations regarding the state of the two climate forcers of the AMO and ENSO.
If one were to look at the official meteorological climatology, which is defined as the period 1991 – 2020, the expected number of storms would be 14 named storms, 7 hurricanes, and 3 major hurricanes. However, part of this official climatology includes part of the last cold AMO, which ended in 1995 . So, if you look at the past 29 years (1995-2023), the climatological averages equate to 16/8/4. (Named Storms/ Hurricanes/ Major Hurricanes)
Going back to the beginning of the satellite era (1966), 8 El Niño events also occurred with a positive AMO occurring in the Atlantic basin. The season that immediately followed these El Nino’s have averaged 6.25 tropical storms, 3.75 hurricanes, and 1.5 major hurricanes more than the previous year's hurricane season. If one simply applied those figures to the 2023 totals, it would translate to 26/11/5. That alone would be an impressive season, with the second most recorded events behind the active year of 2020 with 30 named storms.
Of those eight specific seasons, only one (2019) failed to produce more hurricanes than the preceding El Niño influenced season. Moreover, seven of the eight seasons churned out at least one category five hurricane. The other (2010) had a hurricane right on the cusp of Category 5 intensity (135 kt). As mentioned, the Pacific Basin will be moving into a La Niña base state, allowing for less wind shear and possibly more named storm formation in the Atlantic basin.
Therefore, examining the applicable statistics for La Niña years would only make sense. There have been eleven La Niña affected hurricane seasons during the past 29 years that have occurred during the current positive AMO.
The averages for those years are as follows:Weak La Nina’s: 20/9/5 Strong La Nina’s: 15/9/3 All La Nina’s: 18/9/4
As demonstrated, La Niña has accounted for an additional 2/1/0.5 named storm formations above the 1995-2023 average. Surprisingly, lower end La Niña seasons have produced dramatically more named storm activity than stronger La Nina episodes. Now, what we need to watch for this year, and maybe put more weight on, is the La Niña seasons immediately following El Niño. Based on the data, there were 4 between 1995 and 2023. They averaged 16/9/4 or just slightly above average.
Considering the factors above, a well-above-average season (14/7/3) is the most probable outcome.
Given these circumstances, it seems there is an anticipated weak La Niña to develop by the peak of the season. It also appears to be going along with the record of very warm sea surface temperatures already occurring in the Atlantic basin. The insurance industry should expect more activity than last year, which was active. However, as we concluded in our seasonal summary, hurricanes and major hurricanes were normal, and many of the named storms last year were short-lived. This season should have more weight in terms of longer-living named storms and more hurricanes and major hurricanes that would likely push the accumulated cyclone energy (ACE) index above 180 (average is 123). The observed ACE in 2023 was 143.
The best analog years are 1995, 1998, 2005, 2010, 2016, and 2020. The average of these seasons equates to 19/11/5 with an ACE of 198.
Overall, a few of these years were pretty impactful seasons for the insurance industry, such as 2020, which was not kind to the state of Louisiana. 1998 was not fun either, with Hurricane Georges. However, a few of these years, like 2010, had a lot of activity, but most of the activity stayed away from the U.S. like last year. Years like 2016 were not a big loss year, but if Hurricane Matthew, a category 4 hurricane, had tracked 50 miles to the west, it would have been a completely different story for Maimi and South Florida. In general, the average insurance industry loss for these analog years was $21B. We know that after last year, Idalia's loss was the lowest level ever observed by a 115-mph landfalling hurricane because of its landfall location. Therefore, the location of these potential storms in 2024 makes a huge difference.
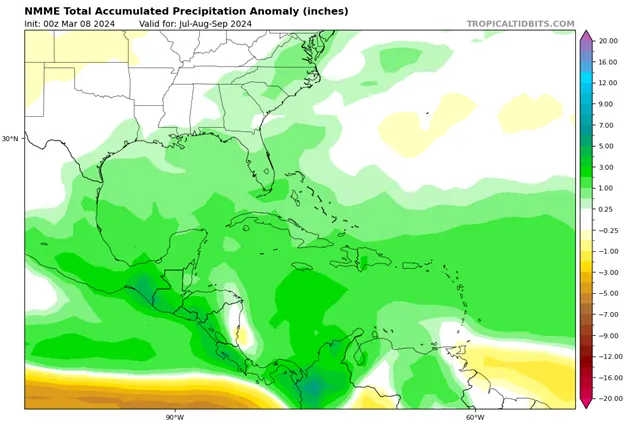
Expected Tracks:The analogs can give some ideas of expected tracks for this upcoming season, but we can also use climate forecast models. The forecast for precipitation rate can tell us where named storms might track. As shown in the figure below, from the central Atlantic to the Gulf Coast, there is a lot of above-normal precipitation expected in the climate models over the months of July, August, and September. The forecast shows that areas along the Caribbean, Gulf Coast, and Florida will have a high chance of seeing wetter than normal conditions, likely resulting in name storm activity during this period. To some degree, one can almost sense there will be a couple of recurving storms up along the east coast of the U.S.
As discussed, it is a bit early to call this the season from hell. As for the insurance industry, that will ultimately depend on where the final track of these named storms takes place. This BMS tropical update only looked at two climate forcers. However, there are other specific conditions necessary for hurricane development. Besides warm water above (80°F) extending to a depth of about 50 meters (150 feet) and low wind shear, storm formation requires high humidity and moist air. In addition to some types of general instability include pre-existing disturbances such as tropical waves. Since many of these items are not predictable this early into the season, the best thing for the insurance to do in the meantime is to understand their role in helping individuals and businesses recover from the financial impact of hurricanes. This includes:
Developing emergency response plans to ensure swift and effective assistance to policyholders in the aftermath of hurricanes.
Educating policyholders on hurricane preparedness, mitigation measures, and insurance coverage options.
Offering risk mitigation services such as property inspections, building retrofits, and loss prevention measures to help policyholders minimize their exposure to hurricane damage.
This proactive approach can help reduce insurance claims and losses.
Of course, during the 2024 Atlantic hurricane season, there will be plenty of ways to stay vigilant and continuously monitor the storm. It is our goal that these BMS Tropical Updates are one of those resources to help you understand weather patterns, climate trends, and emerging risks. This will enable the industry to remain flexible and agile in responding to evolving hurricane threats.


