
It is always baffling that much of the U.S. can be in a deep freeze in December, yet 27 times in history and most recently in 2013, named storms can still occur in the Atlantic Basin. However, no named storms have made U.S. landfall after December 1. Therefore, November 30th officially marks the end of the Atlantic hurricane season, and with that, we can look back at the lessons learned for the insurance industry. In this final BMS Tropical Update for the 2022 Atlantic hurricane season, we will touch on a few aspects that impacted the insurance industry and that might not be mentioned across other channels.
Now, let us quickly recap the season and the various metrics. It is well understood that some metrics like named storm count involve judgment calls by NOAA on what gets named or not, so we need to keep that in mind. This year, four named storms lasted less than two days. Overall, the season ended with 14 named storms; all be it could have been four less or maybe four more, given what might have been swirling over the basin at any given time.
There was a lot of anticipation going into the hurricane season considering the Linkclimate forcers such as La Nina, which can aid in name storm formation because it provides lower wind shear for tropical convection to form. Especially when this is combined with other factors, such as warmer-than-average sea surface temperatures. The Barcelona Supercomputing Center, which collects seasonal hurricane forecasts from 29 different organizations, showed that all but one predicted an above-average number of named storms. The average of these forecasts was to have 17.5 named storms this season. This year’s named storm forecasts were a bust by many forecast shops, but the tight range of predictions around the possible hurricanes and major hurricanes was a bit more skillful.
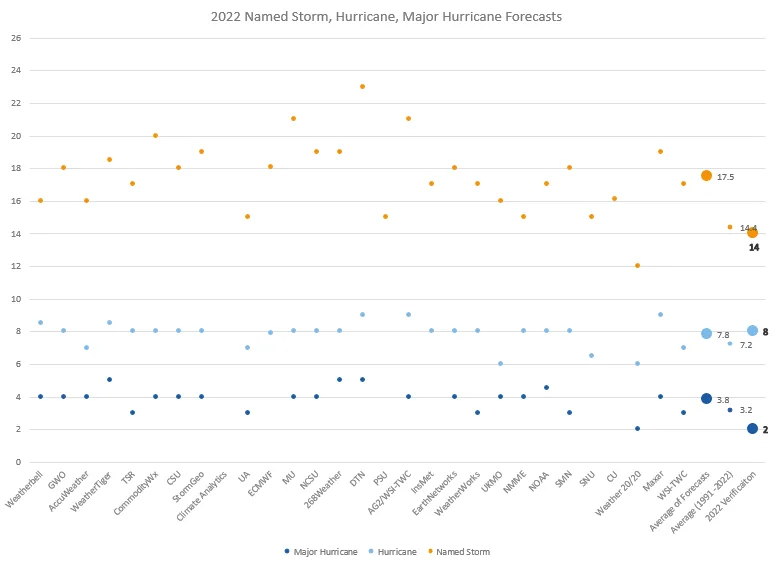
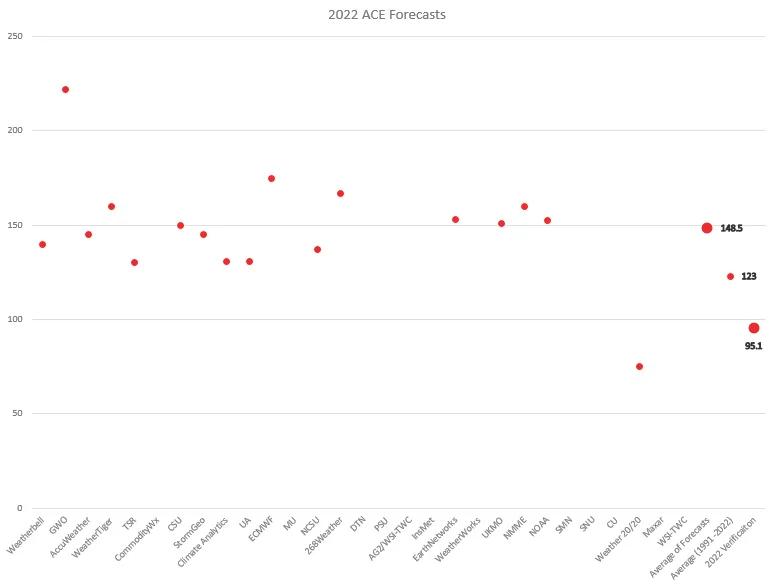
Clearly, 17.5 named storms did not happen and what is maybe more interesting is that most of this activity came within a 30-day period. So, although the season was not hyperactive, it sure had a hyperactive period that corresponded with the climatological peak of the Atlantic hurricane season. Accumulated Cyclone Energy (ACE) is a better measure of the season, and 80.1% of the ACE came within a hyperactive 30-day period, including hurricanes Fiona and Ian.
In fact, our August 15 turned out to be bad karma for the insurance industry after a near-record quiet period between July 2nd and September 1st with zero named storm activity. It was mentioned that "U.S. landfall risk would continue to be elevated with a continued 68% chance of a hurricane landfall, and when the quiet period ended", there could be weather whiplash, and boy was there ever for the state of Florida.
What caused August to be so inactive even when it had that favorable background state and then a sudden hyperactive period? I am sure this will be studied at many meteorological universities, but I think three factors will come to light. The mid-levels of the tropical and subtropical atmospheres were extremely dry. The other factor looks to be that even with La Nina, vertical wind shear was high at times over the tropical Atlantic, and the sea surface temperatures were anomalously cool to normal over much of the tropical Atlantic. During July and August, this prevented activity. The data shows that for a brief period, conditions change to allow for some named storm formation in September. In fact, looking at the Main Development Region (MDR), it really was the Main Disappointment Region for many of the seasonal forecasts. Still, you might notice all the activity in the North Atlantic. This is likely due to warmer-than-normal sea surface temperatures in this region this year, so there is something to say about how sea surface temperatures can also influence storm formation and intensity during a season.

There is no doubt that the last few years have been bad in terms of natural catastrophes for the insurance industry, and often U.S. hurricanes drive the overall losses, which has been the case for the last several years. In fact, of the U.S. insured loss between 2017 and 2022, 46% of the total has been the direct result of named storms. This is remarkable because between 2009 and 2015, the insured loss was only a mere 20% of the total, and most of that was Sandy. This is called weather whiplash. And suppose hurricane landfalls follow a Poisson distribution. In that case, this distribution is correcting in a significant way given the drought of hurricane landfall between 2009 and 2015 when only 3 U.S. landfalling hurricanes occurred compared to the recent seven-year period, which has had a total of 19 landfalling hurricanes and for the first time since 1878 - 1882 that the U.S. has had two or more hurricane each year. However, it should be noted that even with the recent active seven years of activity, there is still no long-term trend in U.S Hurricanes.

Unfortunately, the two hurricane landfalls this year happened on the Florida Peninsula. This ended the lucky streak on the Peninsula that had gone five years since the last landfall on the Peninsula and the first landfall on the east coast of Florida since Hurricane Katrina in 2005.
Depending on how you look at the loss data, Ian could very well be the second largest natural catastrophe since Hurricane Katrina in 2005 if the estimates come in at $40B. Still, when looking at historical catastrophe model results, the loss is still small compared to some events, such as the Miami hurricane of 1926, which today would cause upwards of $150B+ in insured loss. So, although Ian is a significant event for the industry, Ian is not an event that shouldn’t be unexpected for the industry, given a $40B event loss has a return period of 1 in 20 for the state of Florida. This is Florida we are talking about, which already has the highest expected landfall rate along the U.S. Coastline, with an 86% chance of named storm landfall and 56% chance and hurricane landfall in any given year.

When Ian made landfall near Cape Coral with Category 4 intensity, it was a bizarre coincidence that it was the exact location as Category 4 Hurricane Charley in 2004. This served as an excellent lesson for the insurance industry in many ways. The biggest was that building codes work and structures have been updated after Charley or new construction since Charley showed less damage. This ultimately limited the total loss than if hurricane Charley had not happened. Once again, we saw that water is the new wind, with many communities inundated with flood waters and storm surge, which appears to have been as high as 15 feet along sections of Fort Myers Beach, and once again and, unfortunately, the pattern that water is the leading cause of deaths from Named storms with 150+ fatalities and the deadliest Florida hurricane in 90 years.
Another case of déjà vu with the 2004 season was Nicole’s landfall near Vero Beach, which took a similar path to 2004 Hurricane Jeanne and Frances. Still, luckily Nicole was a considerably weaker hurricane. Another lesson the insurance industry has seen play out time and time again is the aspect of compounding events. Given Ian’s strength and onshore flow, as it moved off the Florida East coast, it caused extensive beach erosion. This was compounded by Nicole’s enormous size and no shore flow, resulting in even more severe coastal property damage. In addition, similar to other past events that have impacted the same areas, like Hurricane Laura and Delta in 2020, Ian’s effects complicated Nicole’s impacts and, in some cases, have complicated the claims process with two events impacting the same area with limited time to recover from the first event. The final lesson to point out for Nicole here is that even given its very large extent of tropical storm force winds, the insured loss is fairly minimal, which could be a result of higher wind deductibles. This means there is a protection gap for smaller, weaker events for some policyholders.

An additional lesson the insurance industry has had to deal with was the impact on the insurance industry from Hurricane Fiona. Fiona again showed the fragile nature of the Puerto Rico power grid, which could have led to compounding losses as prolonged power outages impacted the country. But the most significant impact was the historical impact on Atlantic Canada, with one of Canada’s most significant insured loss events to occur at 660M Canadian Dollars, according to the Insurance Bureau of Canada, which obviously could have been much worse had it impacted the growing Halifax, NS metro area. This should be an eye-opening event and treated as a “what if” similar event happened in New England, which again has not seen a hurricane landfall since 1991 Hurricane Bob.
Key Lessons Takeaways:
Seasonal forecast often shows skill, but not always, and frankly, the number of storms and the prediction is pointless for the insurance industry; what the science and forecasts need to focus on is a season ahead is steering currents as it is not the number of storms that form, but where they track and make landfall.
Like 30 years ago, when Andrew made landfall in South Florida during an ordinarily quiet year, it only takes one event for a Hurricane season to be memorable. However, just like after Andrew, building codes will improve, and the built environment will continue to evolve to withstand impactful storms like Andrew and Ian better.
Ian and likely Fiona will be retried, and it shows again that the industry must dread the “I” storms.
The peak of the season is called the peak for a reason, and what happens before does not always dictate what might occur in other parts of the season. This is the first season where a storm did not form in the Atlantic basin before June 1
st
, but the tail end of the season, November, was very active, so it is not over until it is over.
Countless other lessons could be taken from the 2022 Atlantic Hurricane season. Some areas remain lucky, like the Northeast U.S., and impacts on this region will be a big question market for catastrophe modeling companies given the lack of recent claims data. Florida’s insurance market is a different beast, however. Once again, the insurance industry and catastrophe modeling companies have a wealth of claims data to understand future impacts better for storms across this region.
We are still determining if we will see the same development from Ian as that was experienced with Irma in 2017, which experienced a 67% increase in estimated losses over three years. It will be interesting to follow various public loss estimates and, of course, the
FLOIR, which seems to be trending to the lower side
of the overall forecast. As the critical renewal season continues, it is excellent news for the insurance industry.
Thanks for reading!