

As Florida and the insurance industry continue to focus on Ian's devastating impacts across Florida, Ian is not yet done. It has one final landfall that will occur in just a few hours as a medium Category 1 hurricane.
Ian Florida Impacts
These BMS Re tropical updates share information about event impacts and resources that can help the insurance industry. Yesterday, the NOAA Geodetic Survey started posting aerial imagery, which will be expanded over the next several days. Aerial imagery has become very popular in recent years for initial assessments of damage. Companies like Nearmap and Geospatial Intelligence Consortium, are applying AI to help quickly understand large areas of damage.
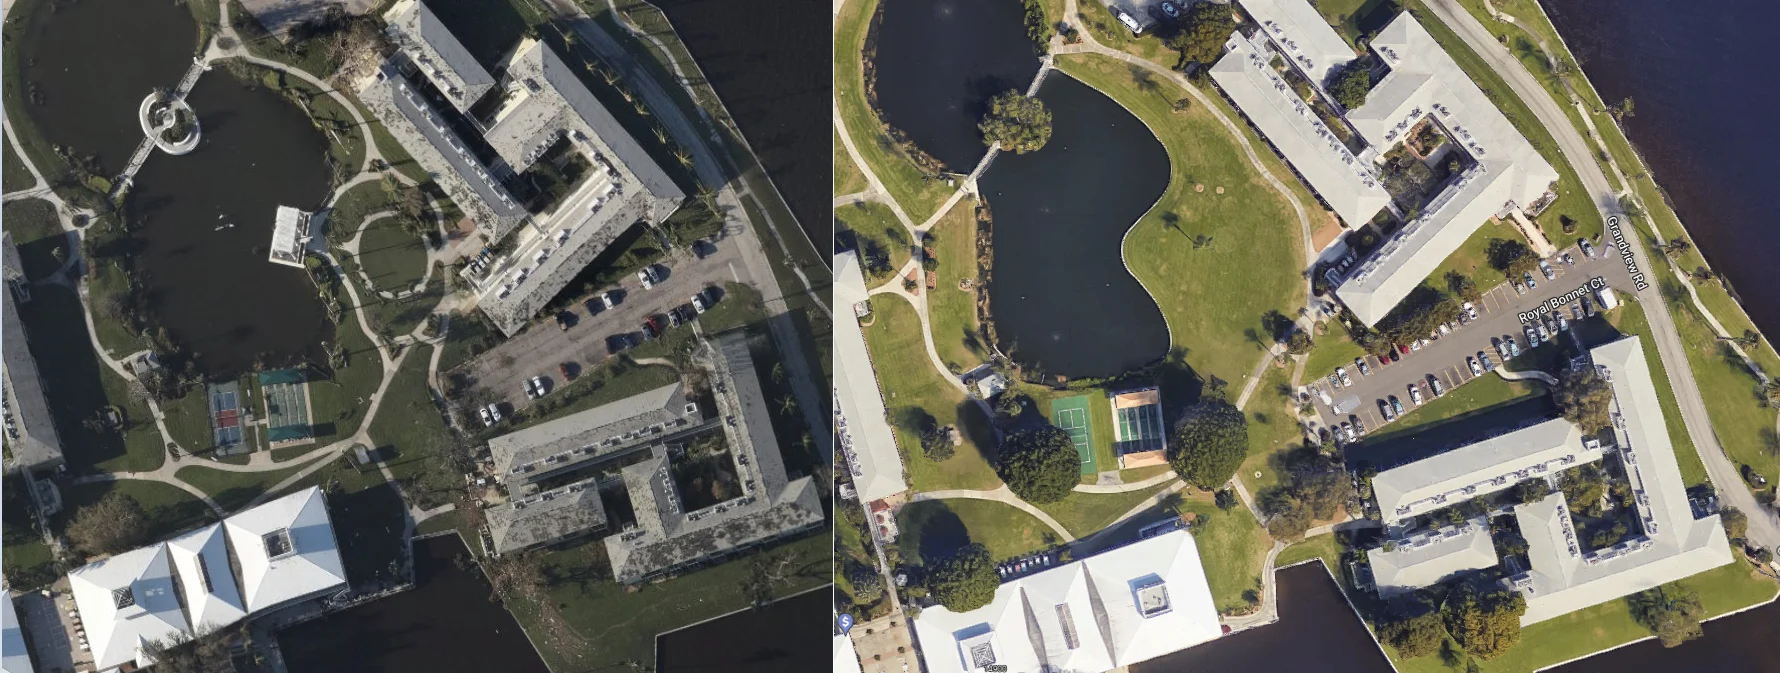
Now, as mentioned yesterday, photos and videos from media and social media show that at first glance, overall building structures and roofs seemed to fair well compared to the impacts of Charley (2004), Irma (2017), and assignment of Benefits (AOB), which resulted in many structures having to be brought up to code. These codes are strict across southern Florida, which ultimately may have limited wide catastrophic damage. But again, the devil is in the detail, and minor repairs add up. There are plenty of photos that show roof faucets and flashing missing, which one will not find on aerial imagery, and this could also then lead to water inundation. Water will be a significant cause of loss from Ian.
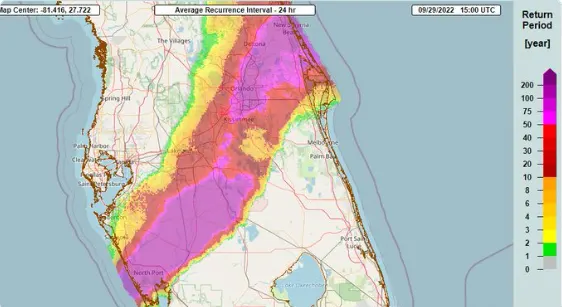
Ian’s storm surge was historic and likely the worst since hurricane Andrew in 1992. The images of boats and cars being in places they should not show just how high the water got in some places. This will be one of the most significant flood-related loss events for the NFIP, given the high take-up rate of flood insurance in coastal areas. It is not just coastal impacts, but many inland areas experienced a wide swath of rainfall that likely exceeded the 200-year return period resulting in significant flooding.
Also, the coastal flooding was not confined to southwest Florida. As Ian exited and moved up the east coast of Florida, its onshore winds brought the storm surge to Historic St. Augustine, Florida, and the entire north coast of Florida. St. Augustine had a storm surge exceeding Matthew’s surge in 2016.
South Carolina Hurricane History
Hurricanes have a long history of striking Florida and then impacting the East Coast of the U.S. Ian’s second landfall in South Carolina is nothing out of the ordinary. As hurricanes should, Ian weakened over land. Still, as soon as Ian crossed back over, the warm gulf stream waters have allowed it to regain strength given the favorable dynamics in interacting with an upper air trough. We might as well stick with talking about Charley (2004), which as discussed yesterday, made landfall in the same location Ian did in Florida. Ian will also make a run at that exact location in South Carolina, which was McClellanville, South Carolina, just miles from the National Hurricane Center’s projected landfall location. Charley made landfall as a Category 1 hurricane with winds of 85 mph, and Ian expected landfall intensity is 85 mph.
Unlike parts of the west central coastline of central Florida, the South Carolina coastline is no stranger to hurricane landfalls. Recently, Hurricane Matthew (2016) made landfall in a similar area as Ian projected landfall location. Matthew was the worst loss for the state since 2000 because the east coast of Florida and north of Florida has not seen a major Category 3+ hurricane since hurricane Fran 1996, which is truly an amazing statistic. The last major storm to make landfall in South Carlina was Hugo in 1989. Matthew caused just over half a billion dollars in damage to South Carolina. Isaias, in 2020, tracked just offshore in, but its insured loss impacts were minimal to the state.
Ian Impact on South Carolina
Ian likely has an expansive wind field because it is undergoing extratropical transition. The expansive wind field of tropical storm force winds will likely increase the likelihood of tree damage and power outages. Unlike the landfall location of Ian in southeast Florida, the tree canopy of the Carolinas is much thicker and composed of deciduous that do not do as well in hurricane-force winds. This could result in more significant tree damage and power outages, but it is helpful that Matthew and other tropical storms have frequented the area in recent years.

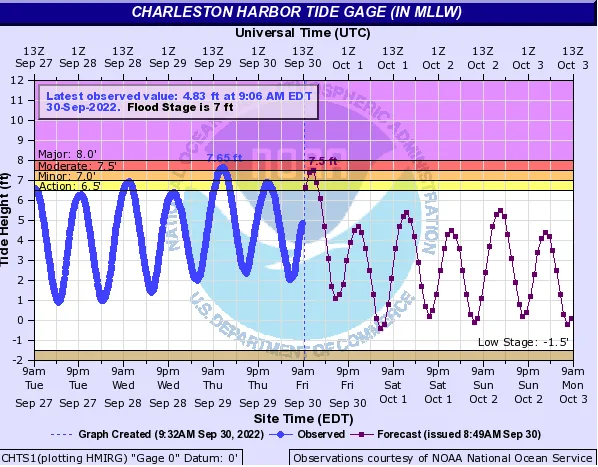
The areas of landfall are relatively rural, but the strongest hurricane force winds are on the left side of Ian’s track closest to Charleston. Given the expansive wind field, areas like Myrtle Beach could see strong tropical storm force winds. Storm surge should be limited, but as in St. Augustine, areas prone to storm surge and flooding could see some storm surge up to six feet. Charleston is prone to storm surge, and the forecast is for seven feet of flooding to occur at the Charleston Harbor Tide Gage.
Buckle Up
Yesterday, Colorado State University issued a new two-week forecast that covers September 29th – October 12th, which calls for Atlantic hurricane activity in the next two weeks to be above-normal (55%). With normal (40%) and below-normal (5%) being less likely. They also anticipate well above-median October-November Caribbean Accumulated Cyclone Energy. The reason continues to be La Niña, and strong La Niña tend to be back heavy with hurricane activity in the western Caribbean, and Ian has shown this so far this season.
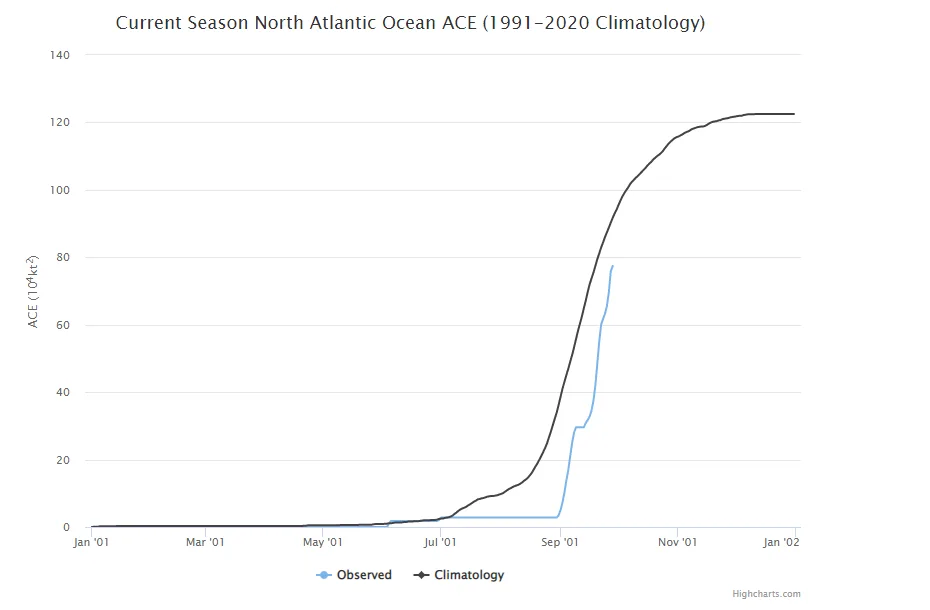
According to the Accumulated Cyclone Energy (ACE), which is an integrated metric that accounts for storm frequency, intensity, and duration, this September has managed to top the active September that occurred last year and 2020. September 2022 has generated an ACE of 75.1. Before Sept 2, the basin had an ACE of 2.9. This puts this September year in 11th place for the most ACE since 1980.
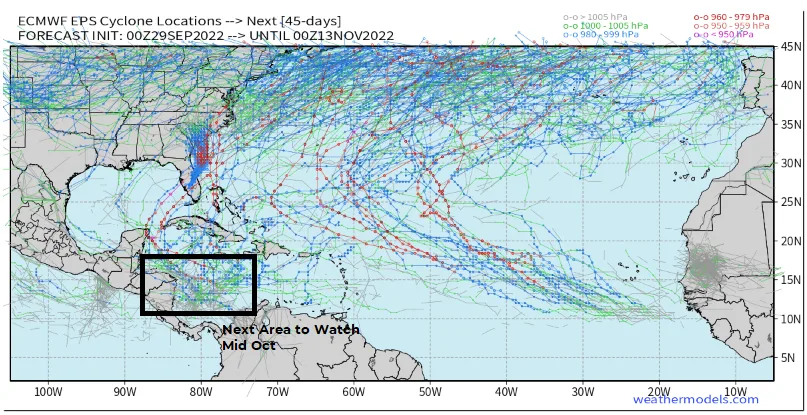
So, what is next? The NHC is only watching a tropical wave off Africa, but as with Ian, tropical waves likely will not do much now that the main development region(MDR) named storm season is coming to a close. As these waves track across the Caribbean and come close to North America and likely into the Western Caribbean, they will be in a better environment for development. As overall activity decreases, there tends to be a secondary bump in seasonal activity towards the middle of October.
Below is a look at the next 45 days from the ECMWF Ensemble through November 13th, which does show some activity with the current wave off the coast of Africa, but later in the forecast period, in the middle of October, the western Caribbean does seem to come alive again.
American Property Casualty Insurance Association (PCI) Side Note
As a side note, I will attend PCI, where I will answer any question about Ian or any other catastrophe-related question in an “Ask an Expert” session. If you are at PCI, please see me at the BMS Re exhibit booth outside the main conference hall on Monday & Tuesday from 8:00 am to Noon.
Plus, do not forget to take the hurricane quiz for your chances of winning a gift card.