At this point in time, there is no need to hype Tropical Storm Ian. This could be serious based on some of the forecast model guidance. Significant surge, inland flooding, tornadoes, and severe wind damage with widespread power outages could be expected with Ian’s potential impacts on Florida in the middle to end of next week. However, in the meantime, before we know the specifics of those impacts, there is a fair amount of uncertainty in both track and intensity. However, first, let us discuss the initial post-tropical storm impacts on Fiona.
Fiona Canadian Maritime Impacts
Much like the country of Puerto Rico after Fiona’s landfall, which still has 657K customers without power out of 1.4M, Nova Scotia has been left in the dark. Out of 500K customers, 414K are without power as of 7 AM CDT. Due to the hard rocky soil, much of Nova Scotia’s power system is above ground, and it will take days/weeks to get the power back on in some locations. The power outages, along with social media and close friends that live in the provinces, suggest extensive tree fall, resulting from weak root systems due to rocky soil and the fierce winds from post-tropical storm Fiona. In fact, of all the times the insurance industry has heard the term Superstorm, Fiona should defiantly meet that definition.
As expected, Superstorm Fiona broke the all-time Canadian low-pressure record with a preliminary low pressure of 931.6 mb. And lower readings might still be found once data loggers from weather stations that could have went offline can be checked.
With a deep low pressure comes strong winds. Sydney, NS airport received a wind gust of 87 mph. The strongest gust observed was in Arisaig, NS, with a gust of 111 mph. A wind gust of this magnitude over such a vast area will result in widespread damage, as indicated by the power outages.
It is too early to provide loss estimates. It would appear the damage is more significant than Hurricane Juan (2003), given the overall extent of the wind field and the number of power outages across the region, which are not just limited to Nova Scotia. Prince Edward Island also is experiencing widespread power outages. Out of its 86K customers, 84K are without power. Also, Newfoundland has also seen damage with Port aux Basques, NL declaring a state of emergency with homes being swept away by the large storm surge.
Tropical Storm Ian Forecast Track
As expected, Tropical Storm Ian formed last night in the Western Caribbean. This is a bit earlier than was forecasted earlier in the week. This morning Ian is firing more convection now that it is moving into a more favorable wind shear environment. This wind shear will continue to decrease as Ian tracks to the west northwest over the next 24 hours. Overall this structural evolution will be critical for the future track and intensity evolution. The other essential component is that a wealth of new data will now be collected to better handle the atmosphere's overall state. This includes multiple aircraft observations, including the two flights from NOAA G-IV aircraft sampling the atmosphere out ahead of Ian’s forecasted track and special weather balloon launches across the U.S. to understand the overall weather pattern better. All this will help with the forecast modeling going forward. However, there is already a really good agreement on the forecast track and the placement of Ian by Tuesday next week in the Northwest Caribbean.
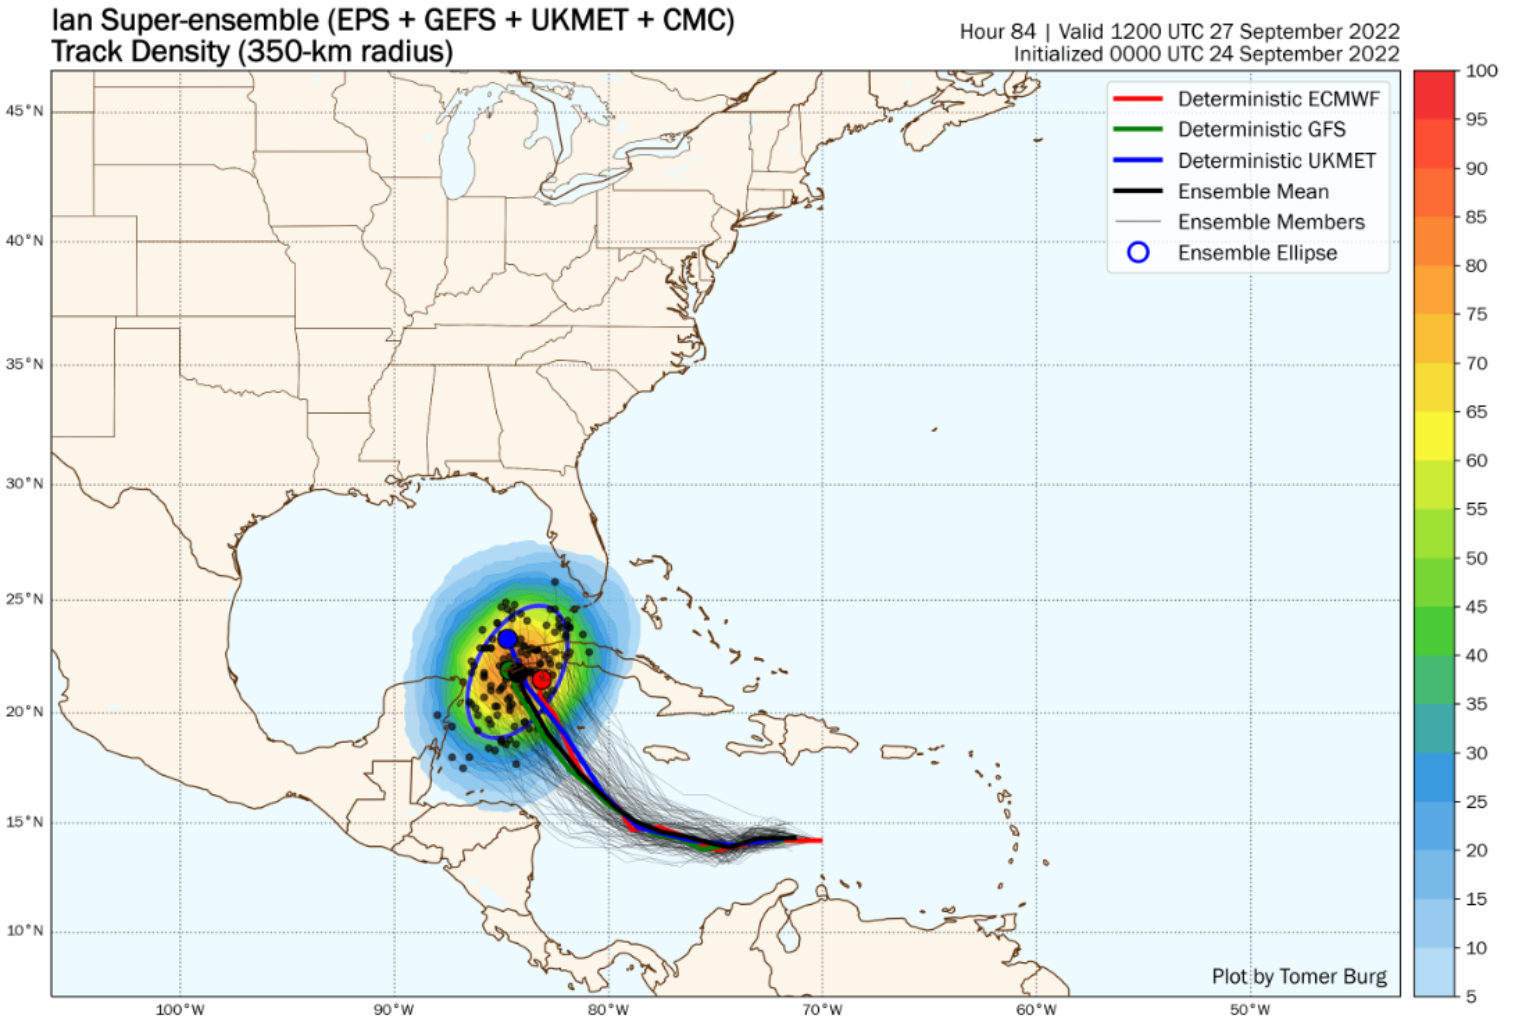
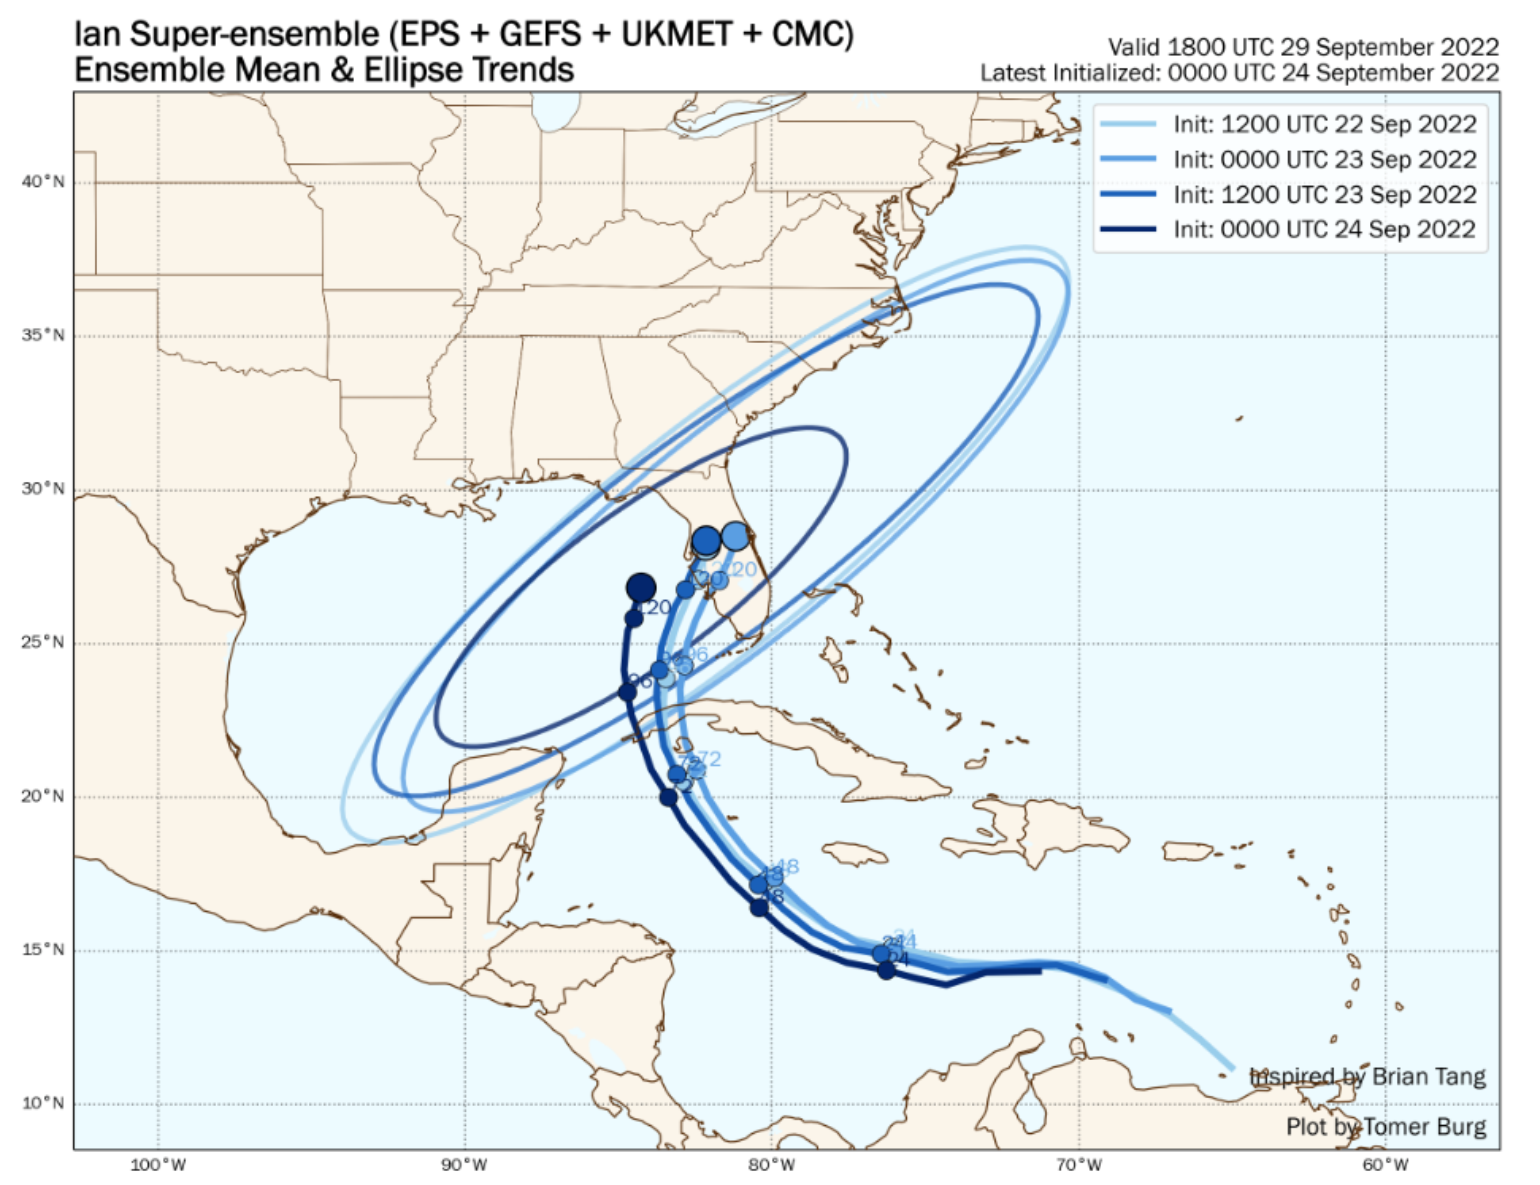
Beyond the 84-hour forecast is when the forecast track uncertainty increases. As the tropical update post mentioned yesterday, the National Hurricane Center track can have an error of 200 miles on the five-day forecast and an intensity error of up to 2 hurricane categories. There will continue to be track adjustments, which have occurred over the last 24 hours, with most of the significant forecast guidance shifting tracks to the west. This overall trend to the west is best shown in Tomer Burg Super Ensemble Mean Trends Plot, which shows that the last four forecast cycles have shifted to the west, and the NHC official forecast has followed this trend.
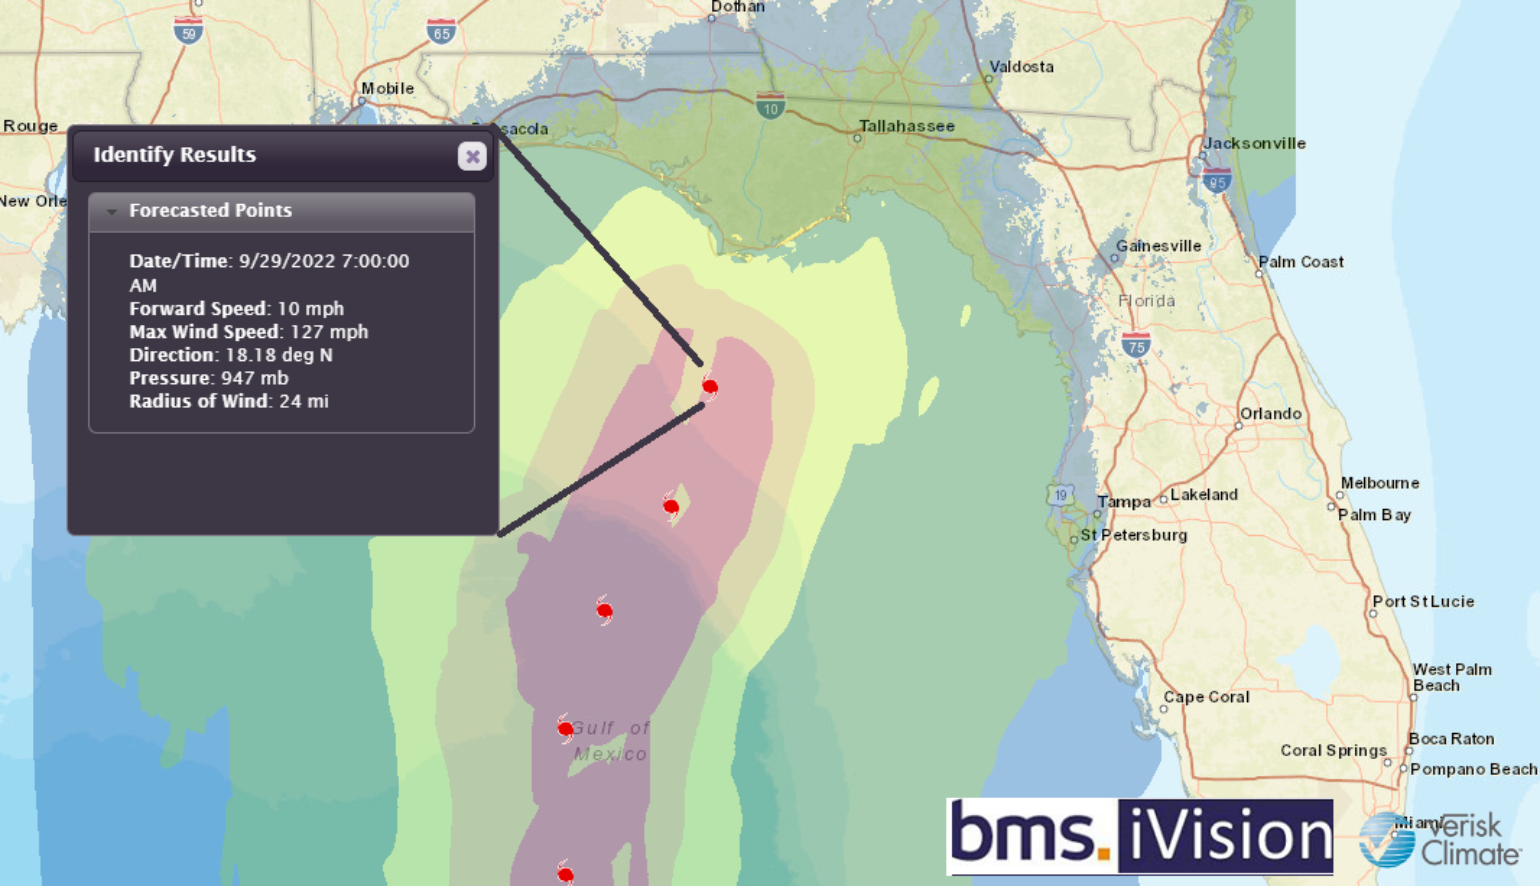
The super ensemble track density shows the chances of Ian impacting are decreasing, while an impact to the west central coastline of Florida is increasing around Thursday next week.
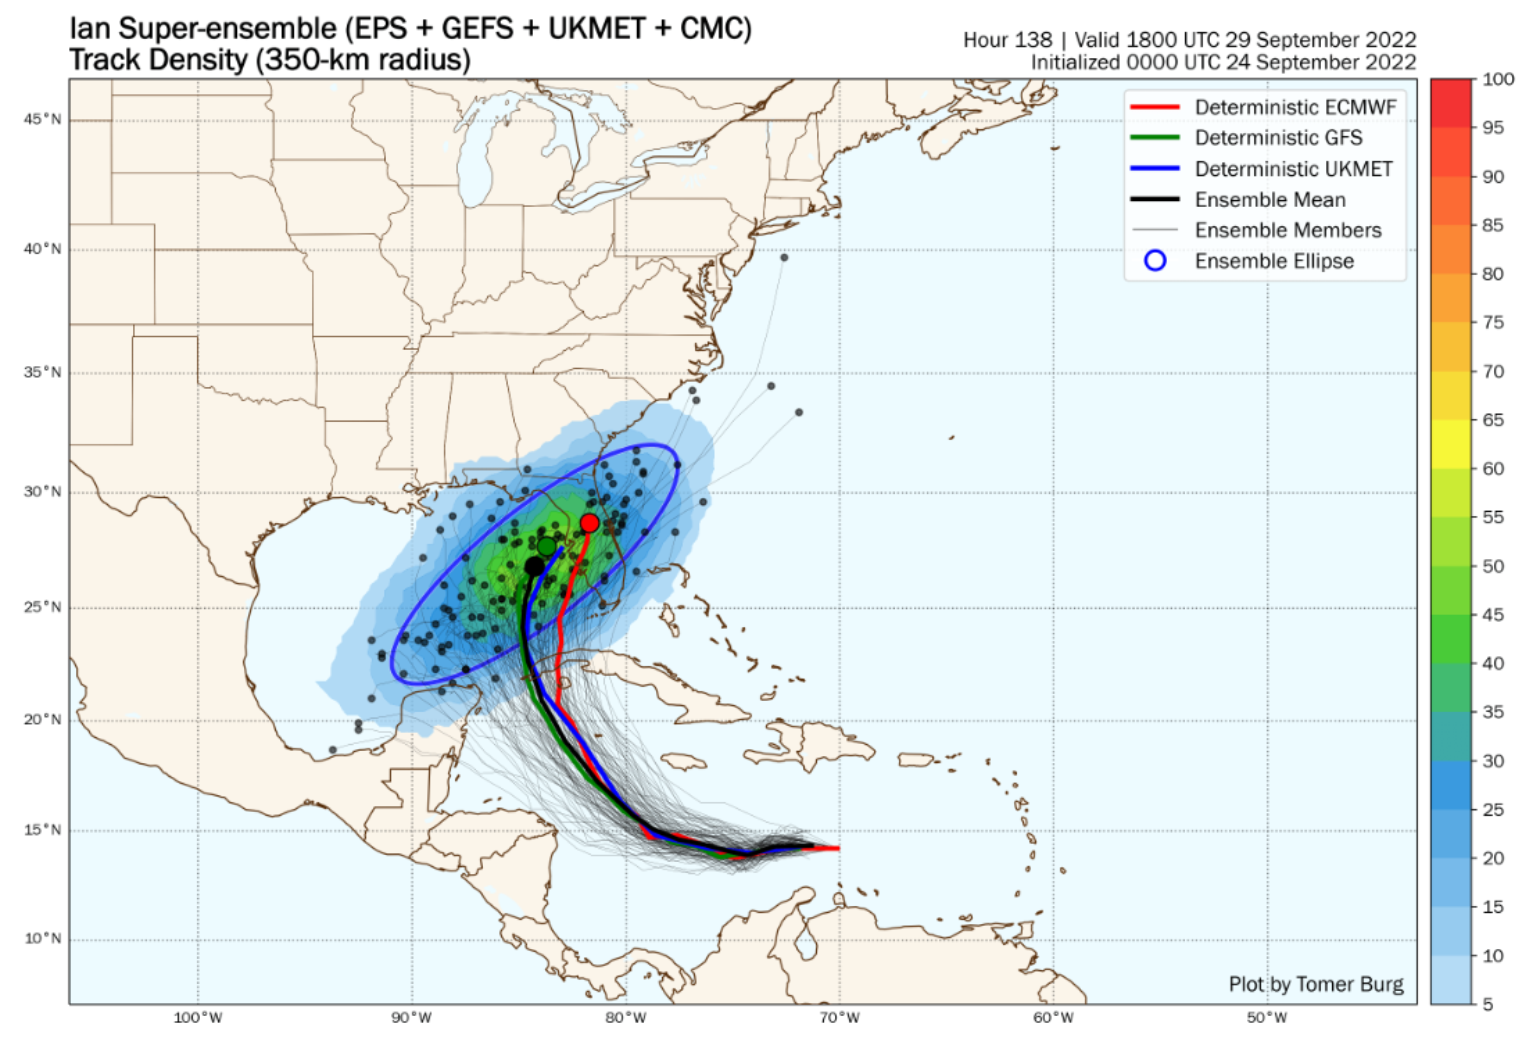
Of course, the overall insurance impacts will highly depend on the track and intensity, which still has a lot of uncertainty.
Tropical Storm Ian Intensity Forecast
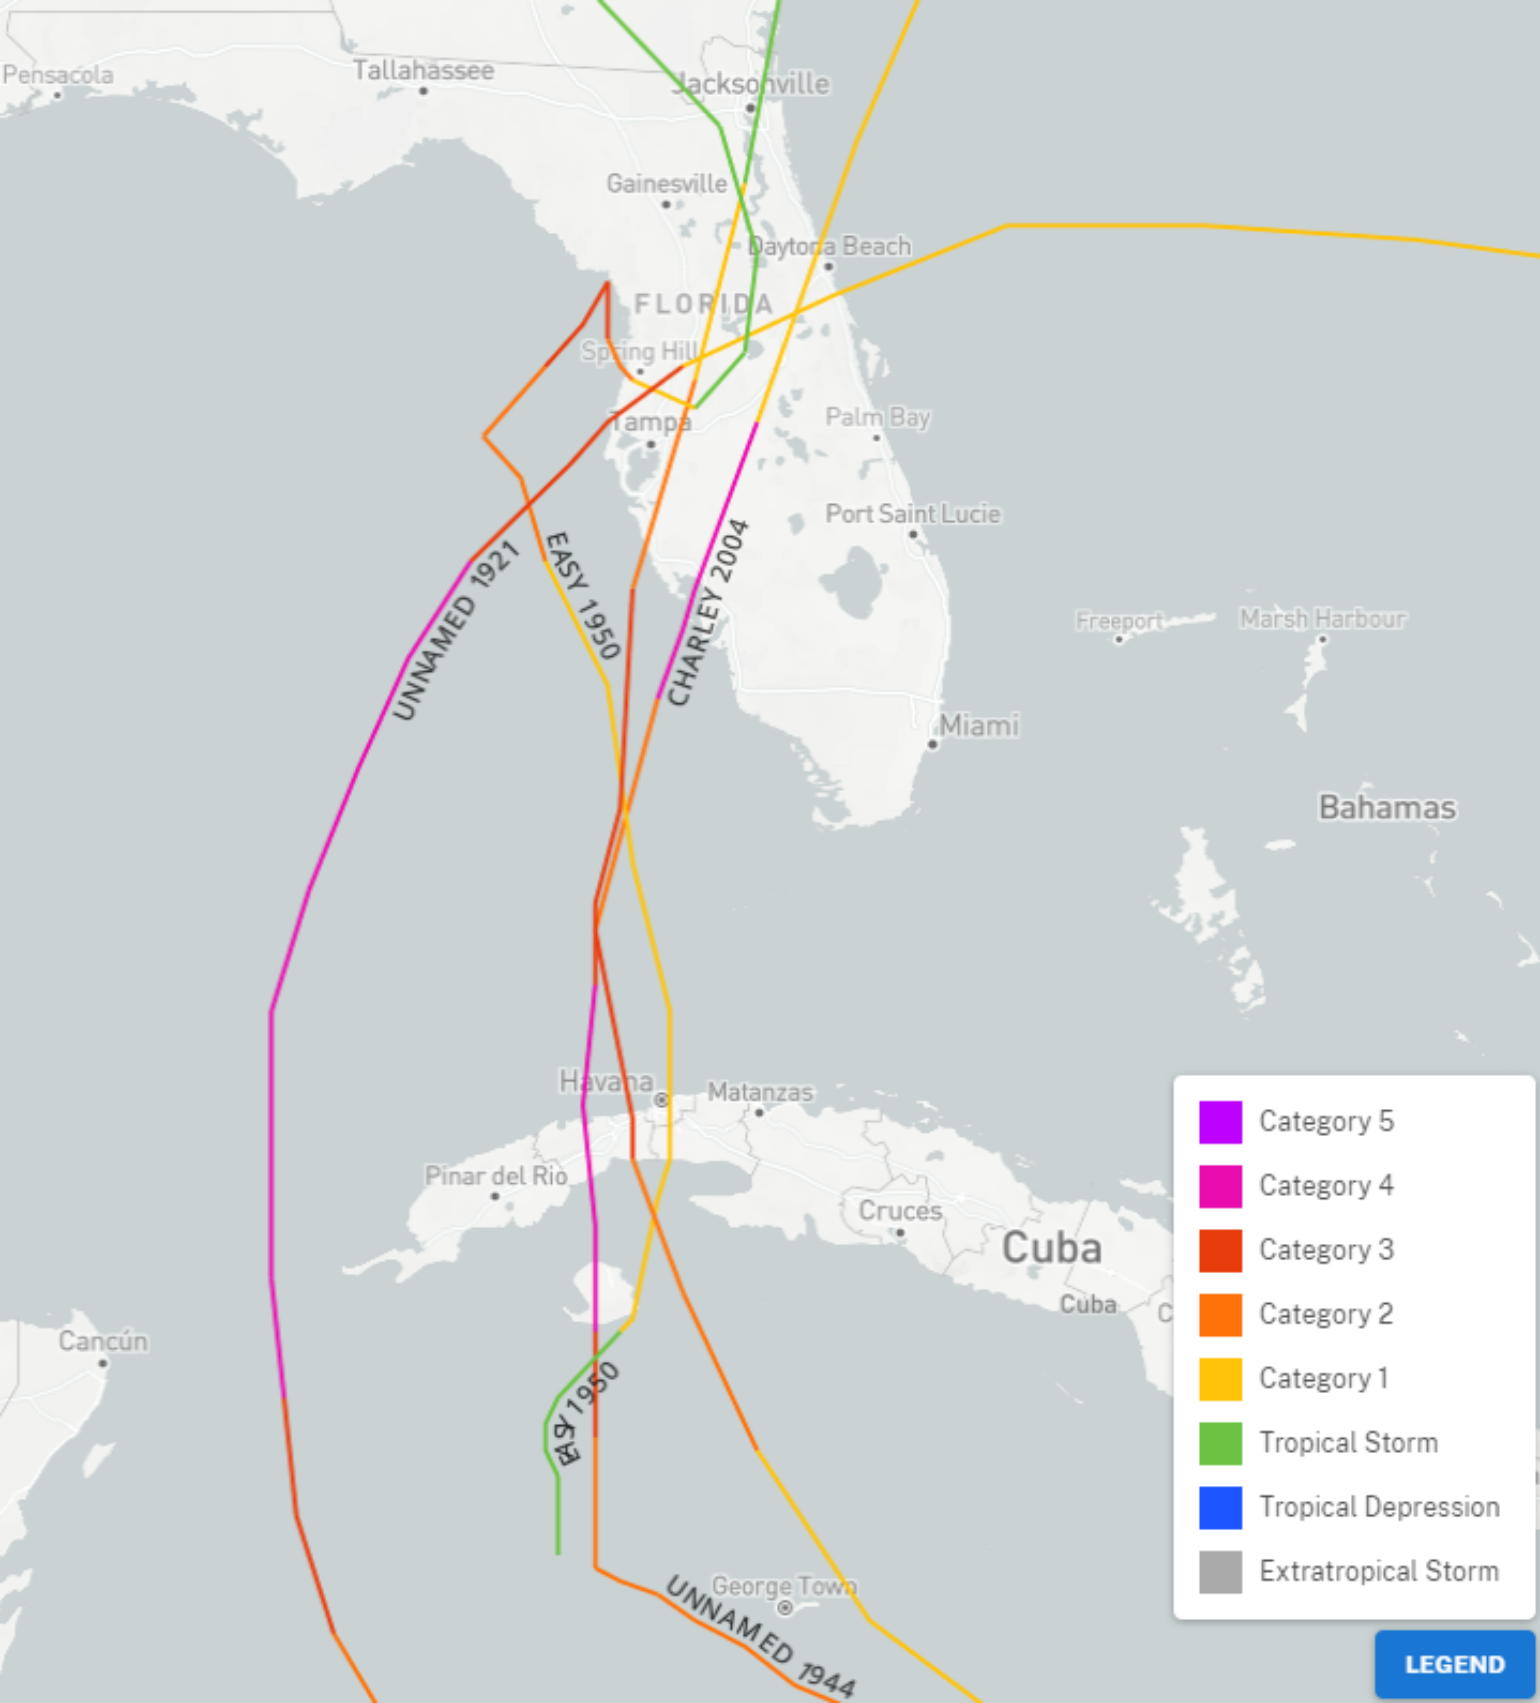
As highlighted in the past tropical updates, Ian is moving into a favorable area for rapid intensification. There is little doubt Ian will be a hurricane near the Cayman Island’s or the western tip of Cuba, as this area has some of the warmest water in the Atlantic Basin. Because of this, combined with low wind shear and favorable upper-level pressures allowing for venting of tropical convection. Ian can quickly become a major hurricane. Still, it should be noted that the NHC is not forecasting this until after Ian enters the south-eastern Gulf of Mexico. History suggests any land interaction with western Cuba would have a limited impact on the overall intensity. Yesterday we discussed how Charley (2004) only weakened slightly but rapidly intensified before landfall on the southwest coast of Florida. What the land interaction can do, however, is change the overall storm size. It could make the wind field smaller or larger depending on what Ian’s structure is before any land interaction.
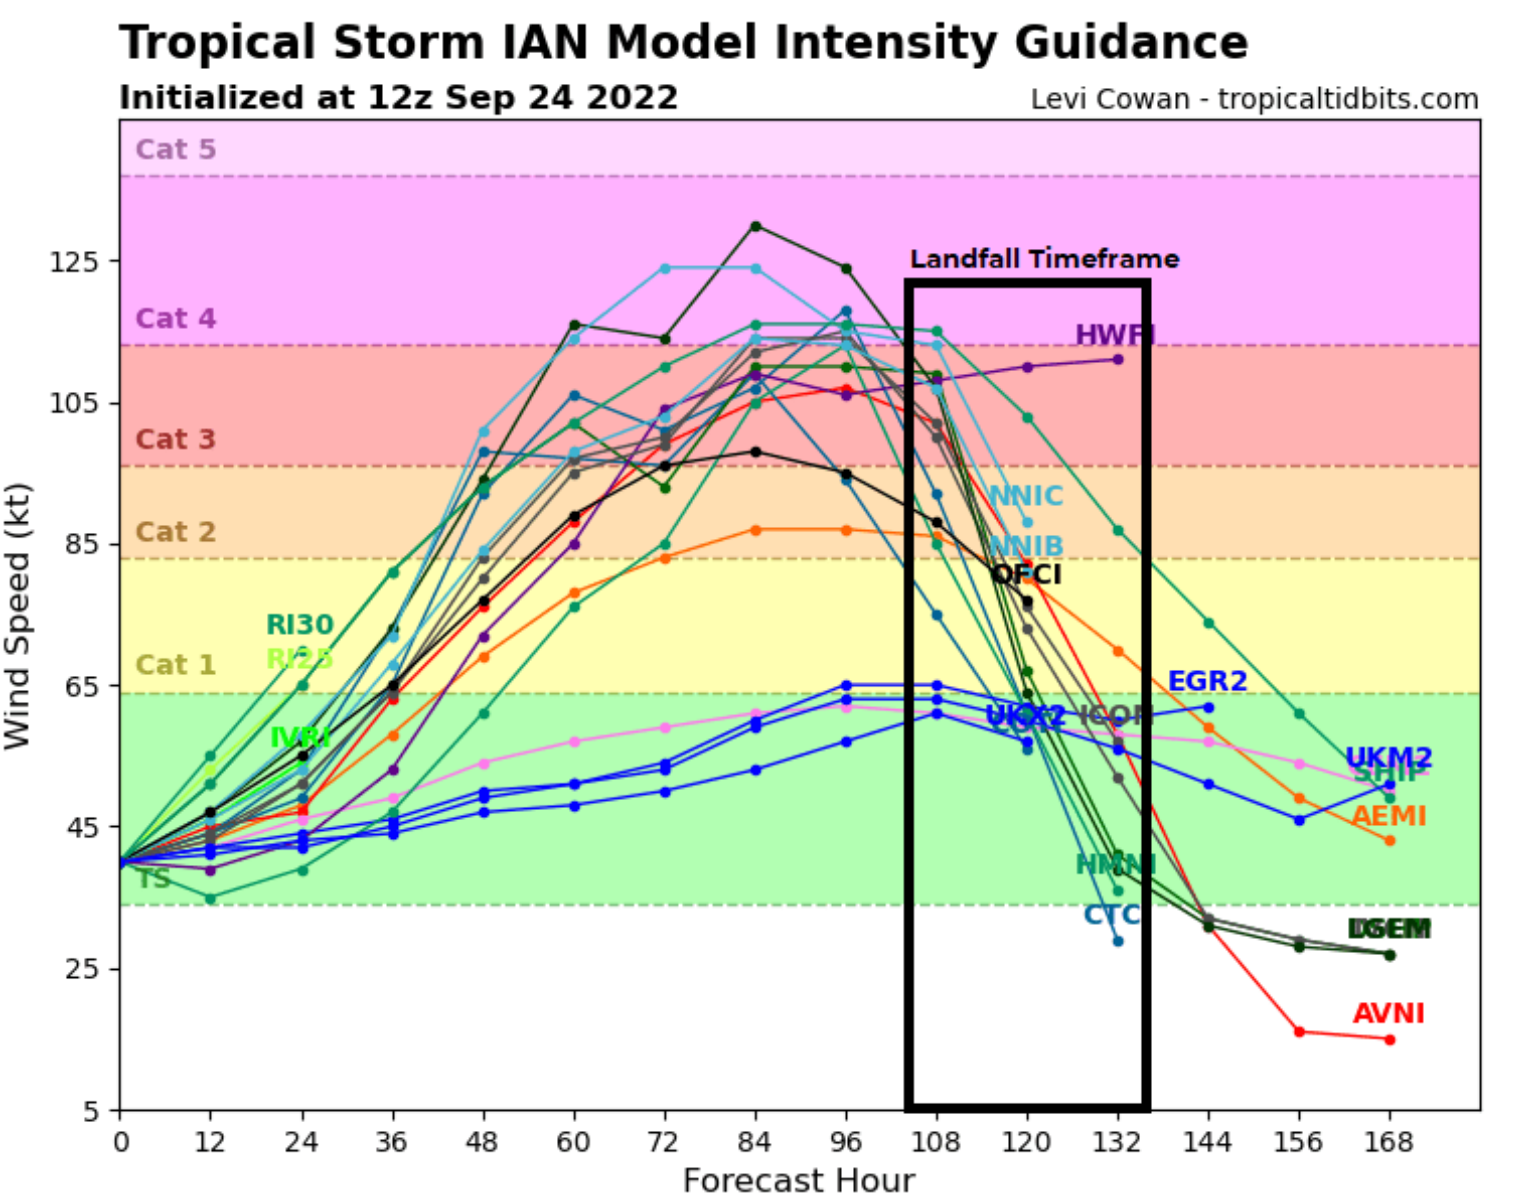
The other complicating factor in the four to six day forecast period will be that some drier continental air and wind shear could increase as Ian tracks further north. This could weaken Ian. The American GFS model suggests this scenario, but other global models, such as the ECMWF model, are not buying this scenario currently. However, this is a possible scenario that has occurred with past storms. Examples include, Hurricane Lili (2002), Ida (2009), Katrina (2005), and most recently with Irma (2017), which was weakened by bringing in dry air as it made landfall near Marco Island, FL.
Insurance Industry Impacts
Overall, there is still a fair amount of uncertainty in the track and intensity forecast. There is only a handful of strong hurricanes to impact the west coast of Florida. Last year was the 100th anniversary of the Tarpon Spring Hurricane that struck on October 25th, 1921, just north of Tampa Bay. A lot has changed along the west coast of Florida in the last 101 years, and the Tampa Bay Times did a great two-part story on the impacts now and then of such a hurricane. These are well worth a read to understand a hurricane's potential impacts on the area. However, it should be noted that BMS Re is not saying this event is forecasted to happen at this time.
Tampa Bay Times Hurricane Impacts on Tampa Bay
Part 1:
Part 2:
https://projects.tampabay.com/projects/2022/hurricane/rising-threat/storm-surge-flood-risk/
Other possible historical examples offer a wide range of possible loss outcomes for the insurance industry that could be similar to Ian’s potential impact. As mentioned yesterday, Hurricane Charley (2004) had a parallel track but a narrow wind swath. Today that could be a $15- $17B insurance industry loss event. Hurricane Easy (1950) was a Category 2 hurricane at landfall but only would result in $2 - $4B today due to its landfall in a less populated area. The Tarpan Springs 1921 hurricane and the high concentration of exposure around Tampa could be much higher, between $15 – $25B, depending on the scenario. The point is that many different possibilities of landfall result in a wide range of expected losses. Hence, until we have more certainty around landfall location, size of the wind field, and intensity, it is a guessing game that will be refined over the next several days. None of the examples above are current loss estimates for Ian, just examples of how different the losses could be.
