

Ida’s Place in History
Last week around this time Ida was an open tropical wave at relatively low latitude off the South America coastline. The long-range forecast models had no issues hinting at what would become of Ida in just a few days. As predicted, it quickly intensified in the Western Caribbean and, according to the National Hurricane Center’s (NHC) best track historical data set, Ida's central pressure fell 40 mb in 12 hr. Only two other hurricanes on record since 1979 have had 40+ mb pressure falls in the Gulf of Mexico in 12 hr: Allen (1980) and Rita (2005). The writing was on the wall that Ida would intensify up until landfall, and if it were not for an eyewall replacement cycle that occurred right around the time of landfall Ida could have been classified as a Category 5 hurricane. In fact, some data might suggest in post-storm analysis an upgrade could still be possible similar to what happened with Michael’s upgrade in 2019.
Ida is the sixth named storm to make landfall in the United States thus far in 2021. This is the most named storm impacts to have occurred on U.S. soil year-to-date in the historical U.S. landfall database. Hurricane Ida made landfall with a central pressure of 930 mb. The only other storm to make landfall in Louisiana with a lower pressure was Hurricane Katrina in 2005 (920 MB). Lower pressure equates to a stronger hurricane. Pending other verification data, as it stands Hurricane Ida had max sustained winds of 150 mph. This ties Ida with the Last Island Hurricane (1856) and Hurricane Laura (2020) for the strongest max sustained winds for a Louisiana landfalling hurricane on record.
Overall this will be a large loss event for the insurance and reinsurance industry and will likely result in an insured loss not seen since the 2017 Atlantic Hurricane season when Harvey, Irma, and Maria individually had total insured losses of over $20 billion each.
Wind Impacts
Many might have been caught off guard at how strong Ida stayed as it tracked inland. As discussed in yesterday’s update, the overall swampy nature of the landfall area would limit any surface friction and the swampy nature at landfall would help feed Ida in what is called the “Brown Ocean” effect. As Ida moved over the swamps of Southeast Louisiana it absorbed moisture into the hurricane, this is similar to what happened from the unnamed depression that flooded Baton Rouge in 2016.
So far the highest wind observation that has been observed was at the landfall location on a ship at Port Fourchon, which reported a sustained wind of 149 mph and a gust to 172 mph. This is right at the design level for any structure in this critical port area.
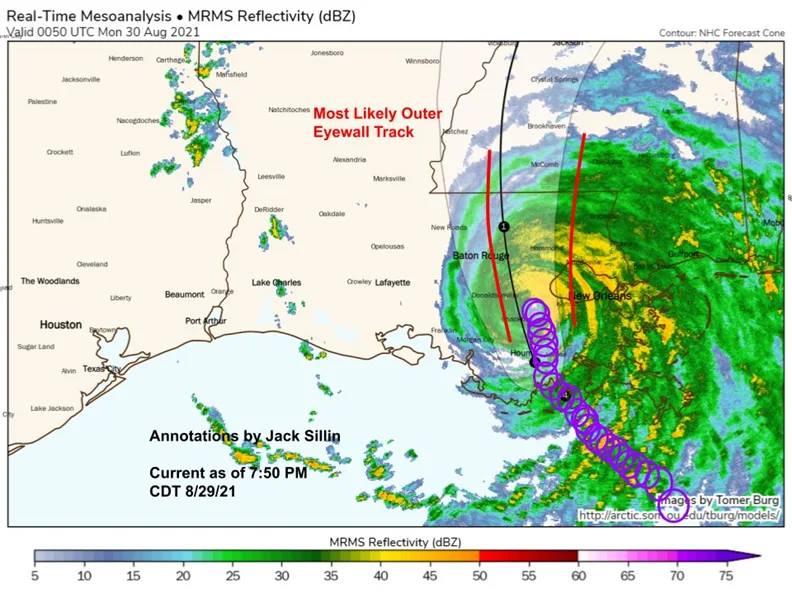
The BMS iVision image below shows the extent of the strongest winds that extended well inland into the city of New Orleans. However, due to the eyewall replacement cycle that appeared to occur at landfall the overall wind field only expanded out to about 25 miles from the center of the storm. This is ultimately critical in understanding the overall insured loss impacts from Ida into the greater New Orleans area.
It is still too early to suggest what type of damage has occurred right along the coastline, as I have not seen many social media posts from these areas. Due to the relatively low population, where hopefully most had evacuated, it will be later today before roads are cleared to get visuals of damage to these areas. There is no doubt that the heaviest damage will extend to the rural towns off of Louisiana Highway 1. These towns include Golden Meadow, Galliano, Cut Off, Raceland, and even Houma to the West. Major damage has been observed on social media in these towns and even de-leafing of the trees is all very telling of the 120+ mph winds that have been observed. Into New Orleans, the winds weakened a bit, but observations were still around 90 – 110 mph and it would appear the ASOS (weather station) at Armstrong International in Kenner stopped reporting shortly after reporting a peak wind gust for the day of 90 mph. I am not sure if that was a power, equipment, or communications issue. In this area, widespread roof shingle damage has been observed on social media.

The stronger winds that were experienced in New Orleans were not just a result of the expansion of the eyewall due to the eyewall replacement cycle, but due to a wobble to the north. Jack Sillin, a student studying atmosphere science at Cornell, did a great job tracking the wobble of Ida as it tracked inland. As mentioned in all the previous updates, the track was going to be critical as to what type of winds and damage might be experienced in New Orleans. Unfortunately, Ida had taken a slight wobble to the north that brought the stronger winds closer to the city of New Orleans. The potential good news of this wobble north was that the strongest winds stayed to the east of Baton Rouge and occurred in a more rural area between Baton Rouge and Hammond, which will limit damage in Baton Rouge area.
As a result of the strongest winds, once again we have seen a catastrophic event take out critical infrastructure. This is seemingly a common occurrence and clearly will have a compounding impact on insured losses. This time the critical infrastructure issue appears to be 8 transmission lines that deliver electricity into the entire New Orleans area. These lines have been lost and are reported laying in the Mississippi River. There is no timeline at this time for repairs, but this is critical and repairs like this could take days. At this time over 1 million customers are without power across Southeastern Louisiana. This is only second to Hurricane Gustav in 2008, which recorded 1.3 million customers without power. Any prolonged power outages will only make the overall recovery slower, and lead to larger than expected commercial business interruption losses, and could lead to mold issues over the next few days.
Storm Surge And Flooding Impacts
As mentioned, Ida will go down as primarily a wind event. In yesterday’s update, it was shown Ida did not have the Integrated Kinetic Energy (IKE) that Katrina (2005) did, which has a direct correlation to the overall storm surge impacts from a storm. Therefore, some of the storm surge observations likely will verify under what was predicted. However, in some parts, there were reported levee breaches. The Braithwaite levee that is not part of the New Orleans levee system was overtopped. This is a local levee that is on the backside against the marshes. The levee also failed in Isaac in 2012. At this time it seems no levees failed that I know of that protect the city of New Orleans. The problem in the city was rainwater, power pumps, and nowhere to send the rainwater. Radar data suggested over a 6 hour period an axis of 10-14" occur near LaPlace. This combined with significant surge flooding occurring off the west end of Lake Pontchartrain caused a levee to fail to protect LaPlace. Interestingly enough just this year ground was broken to upgrade this levee after decades of debate and funding issues.

As mentioned, a positive outcome was that Ida resulted in less flooding because the Mississippi River was at a relatively low level due to the dry conditions across the Central Plains and upper Midwest. There is always the scenario of a hurricane-type Ida event occurring when the Mississippi River is at flood stage and a hurricane would make landfall pushing storm surge up an already flooded river. This is a classic "Known Unknown", but thankfully this scenario did not play out and likely led to a lot less flooding.

Use of Social Media in Ida
Yesterday I was on my phone for a total of 6 hours and 39 minutes and 78% of that time was on social media. That was mostly after shifting away from my desktop computer doing client-related catastrophe response work, which during an event always has a screen devoted to social media streams. I have done several talks now on how the insurance industry can use social media in catastrophe response to get a good read on the overall damage. This is often better than the over-sensationalized journalism that takes place from the major media networks. These outlets will converge on the worst of the damage. Following social media allows for the gathering of personal stories of the impacts, which often detail what has occurred at their individual property or business. This is the story they want to share with their friends and loved ones. Due to debris or powerlines on the roads, some media outlets cannot even get to these areas to even know if there is damage.
The general idea of using social media is to also look beyond the main focal point of what is being shown. Look at other buildings and trees in the background, as a lot of information can be taken from this type of content. Also, when you take a wider look at social media and what is being shared, you can get a sense of what general areas might have experienced the worst of the damage so claims adjusting staff, restoration companies, and tarping services can be deployed to the right area faster.
Another good way to use social media is via crowdsourcing. Firms like crowdsourcerescue.org put together services that highlight where people need help. This can help pinpoint areas of the highest damage.
https://crowdsourcerescue.org/campaigns/home/289
We Need to Learn from These Events
Ida is the 7th Category 4 or 5 hurricane in the last four years to hit U.S soil since Hurricane Harvey in 2017 broke the 12-year major hurricane drought. The 12 years without major hurricane impact in the U.S. was a very long time for science to stand still and not understand the impacts major hurricanes can have on the insurance industry. For all the past major hurricane landfall teams of scientists and engineers got ahead of the storm to layout special observational equipment to better understand the impacts and Ida was no different. As an example, Texas Tech Hurricane Research Team put out an impressive array of instruments ahead of Ida.

This array of sensors can then be used by the insurance industry and catastrophe modeling companies to better understand how these very strong winds impact a building in terms of damage. Also, the number of claims and overall losses can be gathered from insurance companies and used against the BMS Storm Reporter product to help develop a ratio that will better inform early loss estimates of future landfalling hurricane events. If the industry can better understand the impacts of events like Ida and engineering improvements can be made to homes and businesses, it will allow them to become more resilient. This will ultimately lower the overall risk of damage and loss for the insurance industry and should make it much cheaper for all policyholders to insure property risks.
What Is Next
Ida is now heading north at a tropical storm into the Tennessee River Valley where further insured loss could result. Later today Ida will begin its transition to an extratropical cyclone. While the energy is mostly removed from the destructive winds, Ida is dragging massive amounts of moisture north into the northern latitudes. This is going to result in flooding rains across Pennsylvania with as much as 10 inches of rain forecasted for the central mountains of Pennsylvania and Catskills which are still recovering from flooding rains from Henri last weekend.

We are still in the heat of the season and the NHC is watching other areas of tropical trouble. At this time the tropical wave off the coast of Africa looks to develop into a major hurricane over the central Atlantic and won't impact any land other than maybe Bermuda. There does not appear to be any new storm activity that will impact the U.S. over the next two weeks so it might be safe to say in terms of U.S. impacts that the peak of the season might be quiet, but the last few years have shown the back end of the season can still be very active.


