BMS U.S. Severe Weather Update July 2023
By now, several insurance publications have mentioned the extraordinarily high cost to the insurance industry for the first half of 2023 as severe weather losses add up. This comes on the heels of our reported record first-quarter losses. Although losses from June are still being tallied, the second quarter for the insurance industry has been near record levels. However, much of this media attention has lacked historical reference to the meteorological aspect of severe weather and what areas have been hit the hardest. The BMS Pathlight Analytics team provides an answer. After all, it is best not to measure the severity and frequency of weather events with insurance losses, but to measure using the weather itself. Many elements can drive weather-related losses over time, like the ongoing high inflationary environment and other social and economic factors. These skew more recent losses higher than historical losses, even if one provides a basic CPI adjustment.
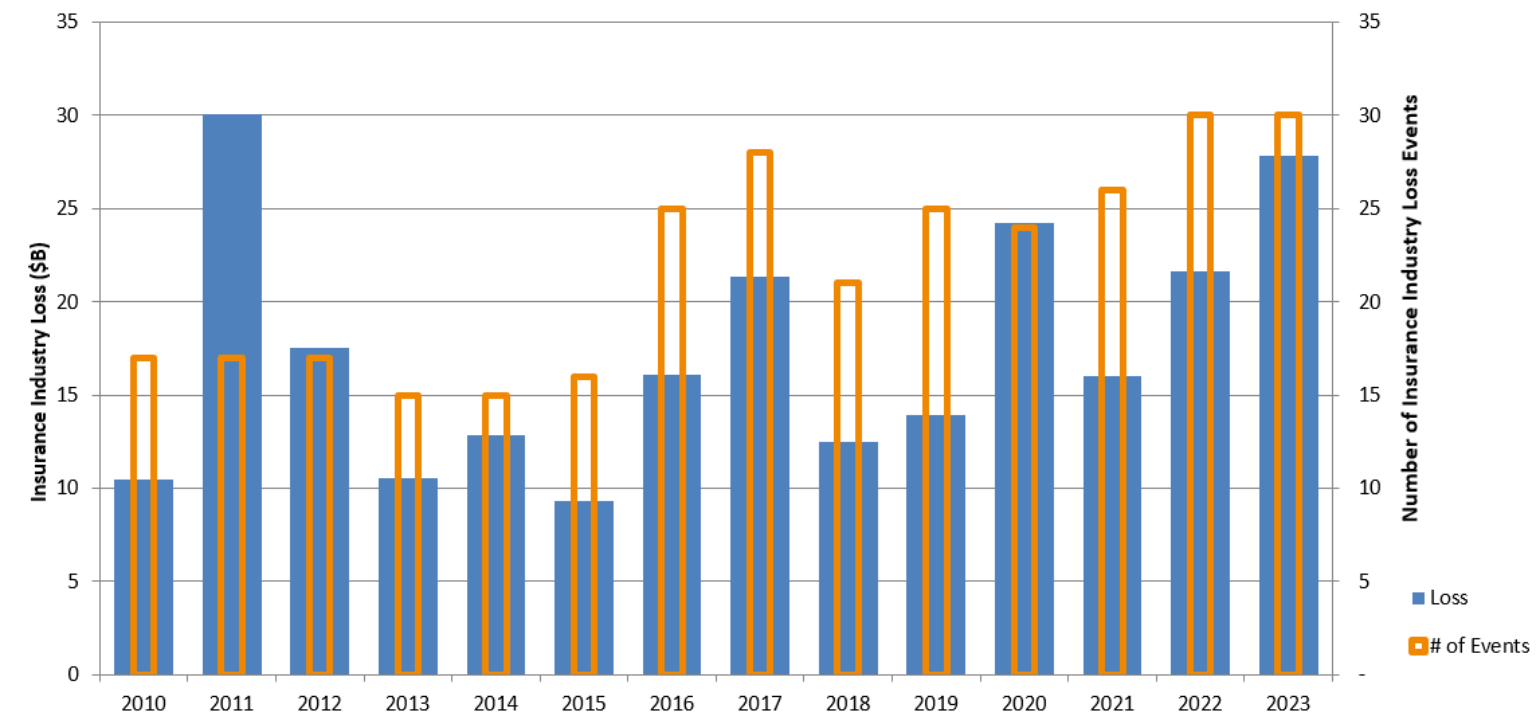
Before we dive into the weather, let us look at the first half of 2023 and severe weather losses as of the end of June, which has indeed been a historical loss month. As highlighted in the last BMS tropical update, Mother Nature was confused about whether it was spring or late summer, given the tropical activity in the main development region. Still, many parts of Central Plains also seem to be experiencing unusual amounts of severe weather, particularly Texas, which tends to start to see less severe weather into the month of June. Thus far, Texas has experienced over $7.2B of insurance loss. Other states that have broken the $1B total insured severe weather loss are: IL, KY, CO, TN, AR, and MO. A factor in some of the higher losses is the severe weather that impacted California at the start of the year with the numerous atmospheric river events.
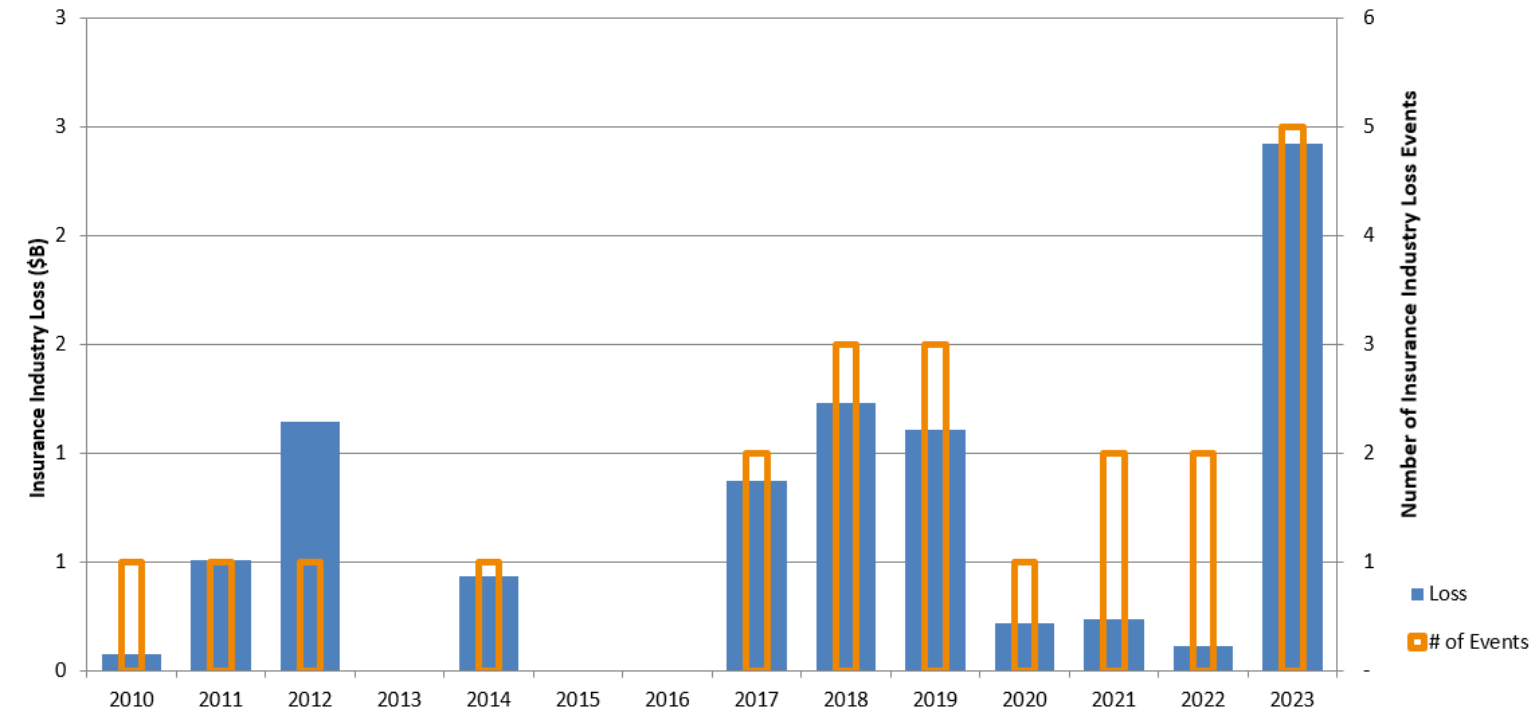
As mentioned, Texas has experienced an unusual amount of severe weather, which continued into June. Figure 2 shows Texas's historical June severe weather losses and industry loss event counts. Even more impressive is that there were several days in June without severe weather across Texas as extreme heat set in as a large heat dome capped some of the formations of severe weather.
Again, using losses to determine trends in weather are complicated, as loss data suggests that socioeconomic elements are the primary driver of an increase in frequency and higher insurance losses from severe weather - even after making the basic CPI adjustments. Therefore it is essential to understand the trends with weather and what is unique about this season so far. We can utilize a few data sets to understand the occurrence of severe weather better.
One of the most common datasets used to understand severe weather trends and the occurrence of severe weather is via NOAA National Weather Service (NWS) Local Storm Reports (LSR). This data set is full of shortfalls from different observational trends and ways to report severe weather to the general purpose of these severe storm reports: verify warnings and watch products issued by the NWS. Nevertheless, they can still be used to generalize severe weather in the aggregate, as these issues generally have less impact over a more extensive regional area than expanding the most recent period of record.
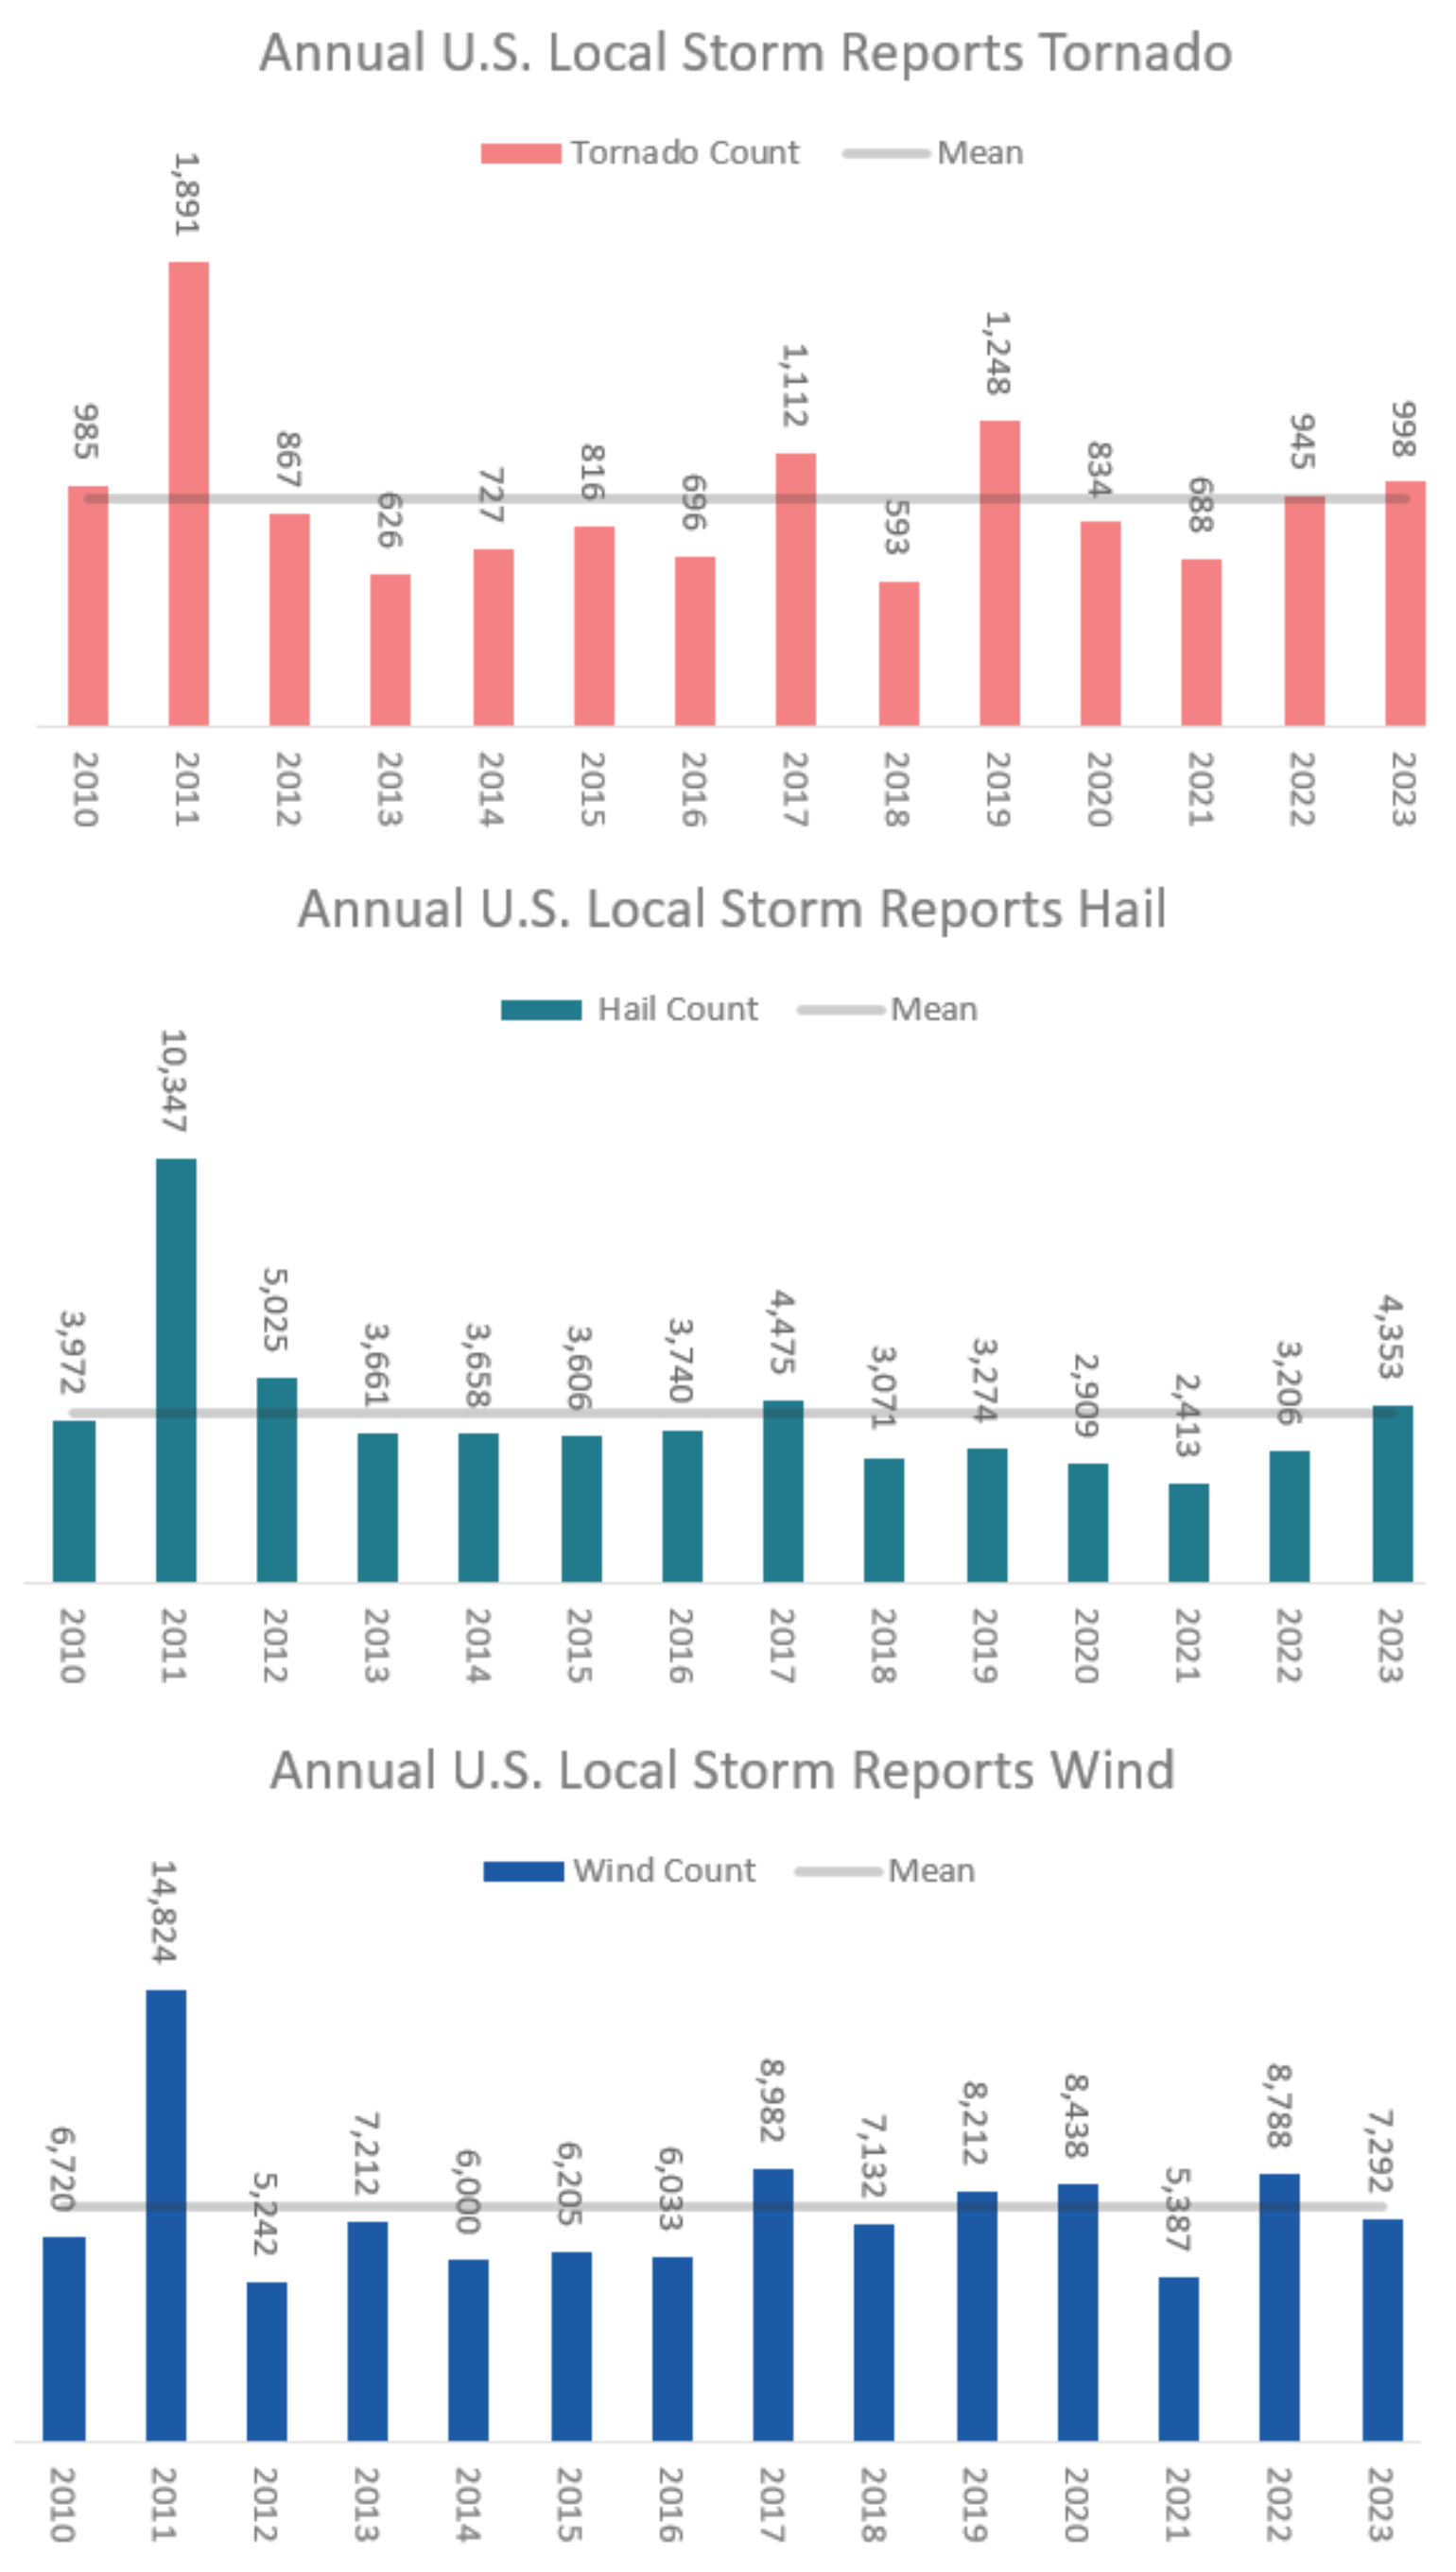
Across the U.S., this spring was very active, as indicated in the LSR counts for tornado, hail, and wind as indicated by the LSR time series plot created by the Storm Prediction Center. In fact, at one point, tornado counts were near a record at the end of March, which corresponded with one of the most active tornado outbreaks on record. As indicated in Figure 3, these reports have since leveled off to be normal based on the year-to-date mean (2010 – 2022). Wind damage reports have also been elevated for most of the year, with a leveling off to mean for June and now stand just below the mean year-to-date. What might be a bit surprising is that hail reports have also been about average. Interesting, given that hail tends to drive 50% - 80% of the total insured loss for severe weather losses in any given year. Therefore, this an observational anomaly, or perhaps the hail is just occurring in over-populated areas like Denver, Dallas, or other urban centers driving insurance loss in 2023. Of course, this is yet another reason not to use loss to determine a trend in weather, as the loss is a significant function of the target impacted by severe weather.
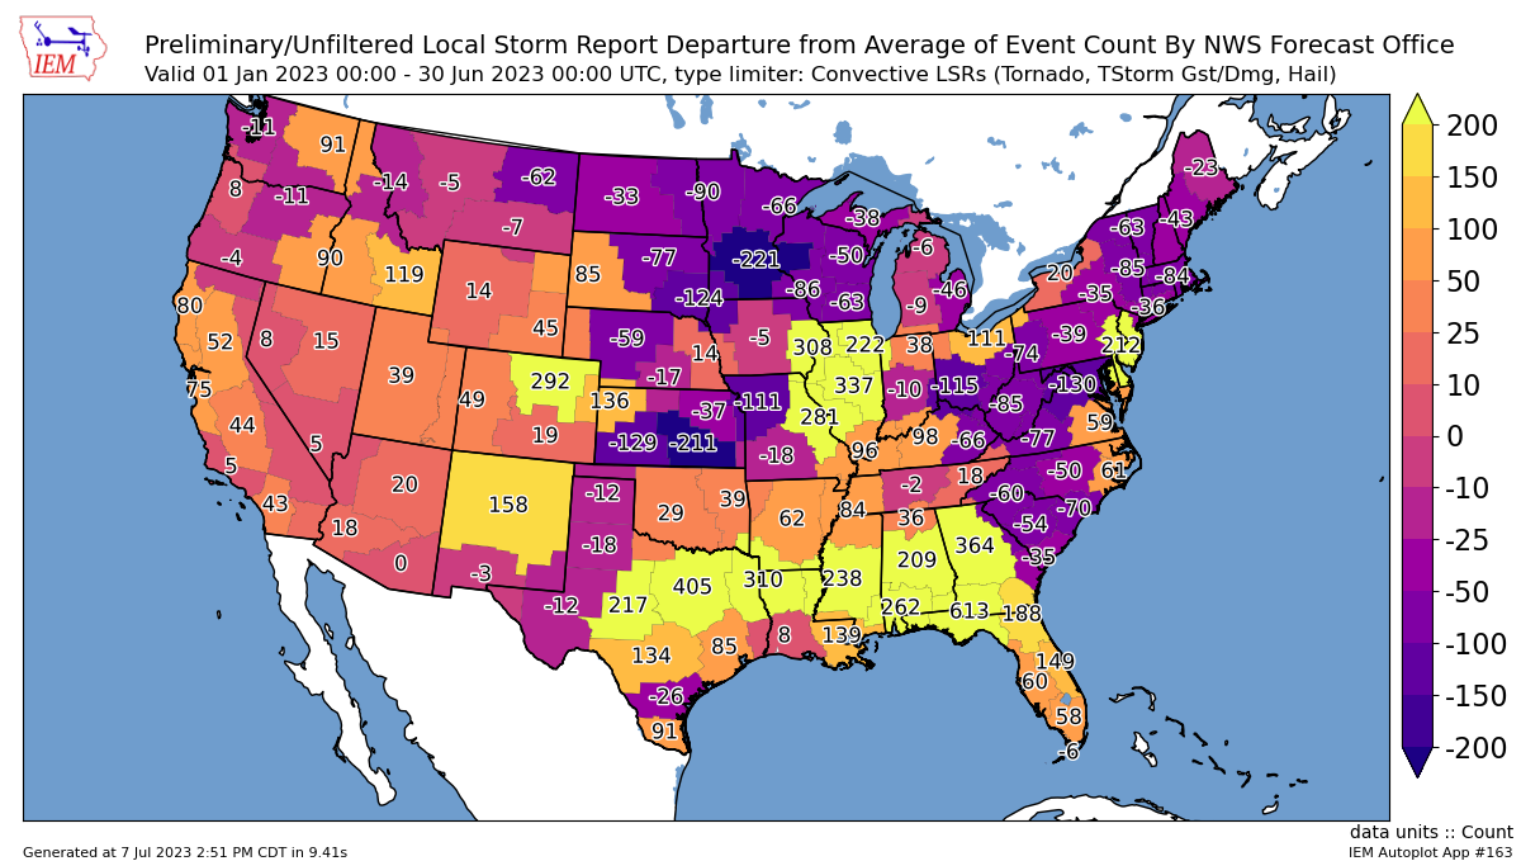
Where is the severe weather occurring and not occurring in 2023 thus far? First, we can show this by a visual count of LSR reported from the various NWS office zones and the departure from the 2002 – 2022 average, as shown in Figure 4. Boulder/Denver NWS office and the entire Interstate 20 corridor between Georgia and central Texas have been elevated. Illinois, western Kentucky, and Tennessee have also been elevated, but this was primarily the result of the March 31 severe weather outbreak. Interestingly, the Mount Holly NWS office in New Jersey is reporting elevated severe weather reports. At the same time, much of the East Coast and mid-Atlantic have seen below-normal severe weather occurrences. The upper Midwest, which has been in a flash drought, also lacks severe weather, particularly around Minneapolis. With their elevated severe weather this year, Florida and California may also raise eyebrows.
There are plenty of other ways to slice and dice the LSR data from NOAA and other products like storm warning data, but another way is to utilize BMS Re’s partnership with Verisk and the Respond products. These products use high-resolution models and radar data to help BMS Re clients better understand the occurrence of severe weather and pinpoint the anomalies. BMS Re has the only industry product that matches severe weather to PCS Industry loss events via our unique historical catalog. This allows us to build a climatology of these events. Figure 5 show the geospatial occurrence of strong wind guest over 60 mph and the occurrence of radar-derived hail swaths of 1 inch or greater hail for the first half of 2023.
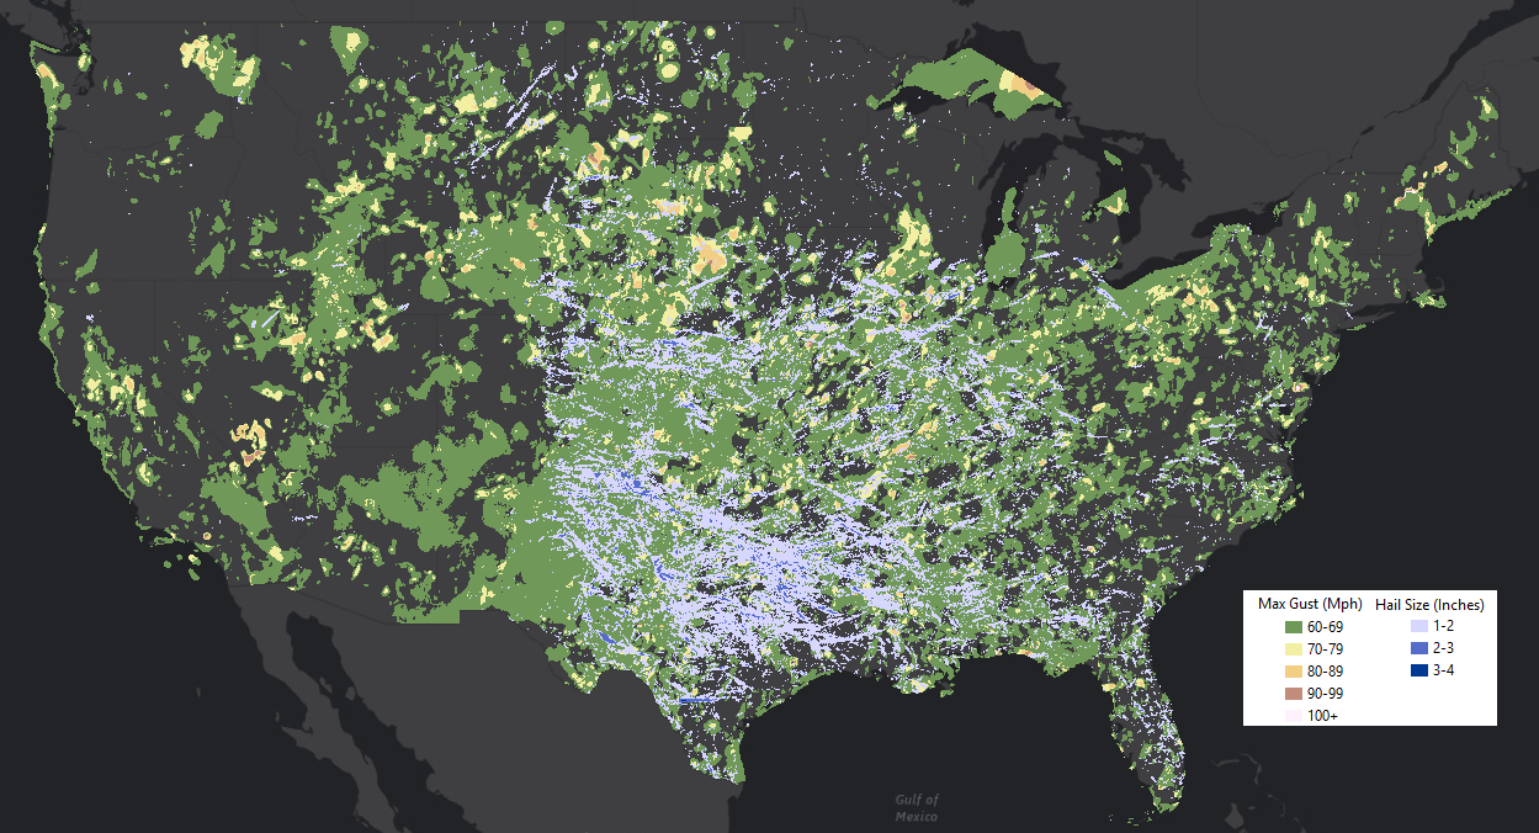
Severe weather has no boundaries. Although the data points to a year-to-date occurrence of severe weather that is about normal in terms of LSR, we also know there was a high occurrence of severe weather during the spring leading to the likely correlation to higher loss levels. States like Texas have taken a beating this year in particular and during the month of June, which is unusual. The high levels of loss from severe weather is not just confined to the “bread basket” states: California and Florida are also experiencing high levels of unusually severe weather this season. According to BMS Re and our analysis between this year and last year, almost no place has been safe from severe weather. This will no doubt be an area of contention as the insurance industry gears up for the all-important January 1 renewals.
