It is hard not to tune into the news or social media and think that Mother Nature has gone mad. Record flooding in Montana, snow and freezing temperatures from Washington to Nevada, record heat east of the Rockies, 90 mph thunderstorm winds in several states thus far this year, tornadoes ripping apart buildings, baseball-size hail, month-long fires in the Southwest, and of course the daily occurrence of expected tropical troubles from a magical long-range forecast that shows a future hurricane in the Caribbean. This BMS insight will look and see if Mother Nature is truly gone mad by looking at the data.
Has Severe Weather Gone Mad?
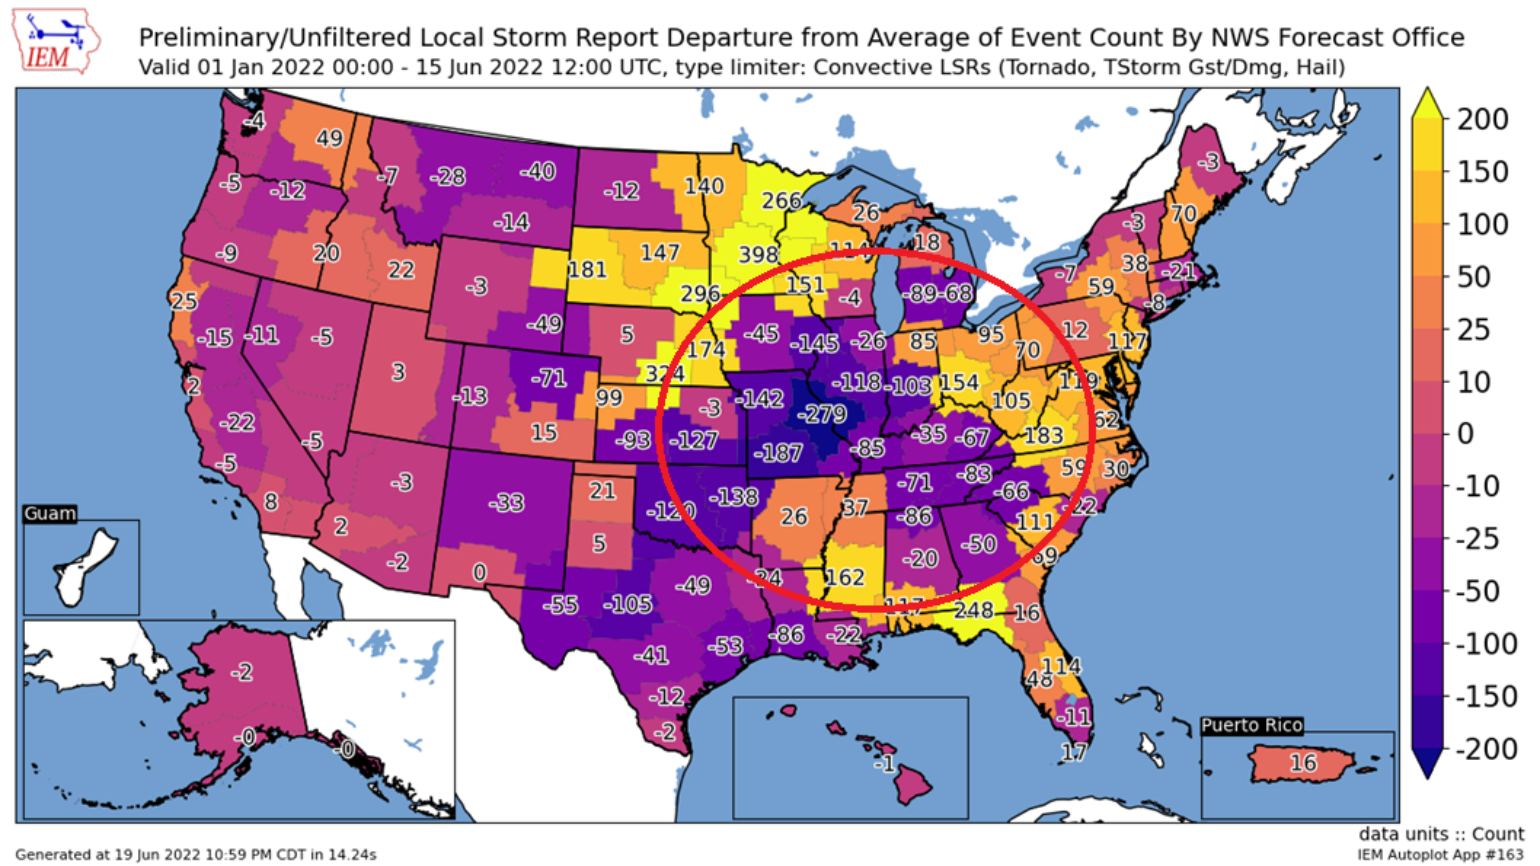
For starters the Central Plains has come alive with major severe weather events impacting the insurance industry every few days as high pressure in the South Central U.S. has created what is commonly known as the “Ring of Fire”.
The ring of fire is a common weather pattern that allows for areas of thunderstorms to develop along the periphery boundary of a high-pressure system with thunderstorm activity rotating clockwise around the dominant high-pressure system in what are often long-lived storm complexes.
One should not look at overall loss data totals to determine a trend in an weather peril; therefore, let us now look at the overall occurrence of the severe weather perils year-to-date.
Don’t forget, the U.S. still has not experienced an EF5 tornado since May 20th, 2013. For the season so far according to the Storm Prediction Center (SPC) the reports of tornadoes across the U.S. are right in line with the 2005 – 2021 average. Hail reports are once again below average, which is important because hail drives between 50% - 80% of the overall insured loss in any given year. However, this year the overall driver of severe weather loss could be due to the above-average wind damage reports across the country. In fact, the only other year with more wind damage reports YTD was the very costly year of 2011. The likely leading cause of loss from wind damage is treefall and wind-related damages are likely leading the cause of loss for the insurance industry so far in 2022.
In the figure below spatially one can see the ring of fire in the SPC convective local storm report departure from average which covers wind gusts/damage, tornado, and hail reports. Much of the northern U.S states and the Eastern Seaboard have seen above-normal severe weather activity this year and many of these events have been wind-related events. On the other hand much of the U.S. is seeing below-normal hail counts for the year. The two exceptions are Minnesota and Wisconsin which have abnormally high hail counts and are adding to the costly event losses both these states are having this season.

Has Wildfire Gone Mad?
Wildfire continues to be yet another very costly peril for the insurance industry. This year so far the focus has been on New Mexico, which has now seen the largest wildfire in the state’s history. The several fires in New Mexico have already destroyed 900+ structures. Further, across the U.S. wildfires have burned about 3 million acres across about 30,000 fires as of June 15th. This is by far the most acres and number of fires since 2012 and well above average. A large number of fires and acres burning is not just due to the fires burning in New Mexico, but the Central Plains this spring and early summer have been extremely dry which has caused large grass fires from Texas to Nebraska. Only recently has this area seen some relief from the thunderstorm that has formed around the Ring of Fire. In fact, recently some welcomed rain has finally come to the Desert Southwest. This which is good for the fires burning in New Mexico and is much-needed rain for the reservoir systems along the Colorado River which are at critical stages and likely within the given year will reach dead pool status as the long-term dry pattern continues based on La Niña in the Central Pacific.
Further west, in what appears to be the now year-round California wildfire season, there has already been a cost to the insurance industry. There have been just over 3,300 fire incidents that have burned 21,343 acres in California year-to-date. However, this number of fires and acres burned is below last year's figures and below the 5-year average. Yet, this does not mean the season has not been costly. Already the Coastal Fire which started on May 11th and was only 200 acres, still likely caused at least $50M in insured loss, based on the impact of at least 21 multi-million dollar homes.
Another amplifying concern for western wildfire is climatology. The western states are entering the lighting season, and even though humans start 84% of all wildfires, lightning-caused wildfires can be costly to the insurance industry. Although it might be counterintuitive as high country summer thunderstorms with lighting also bring moisture, which might decrease the chances of a wildfire starting, what matters is vegetation aridity. Wildfires are not binary. There is no line or guidance that says fuels are dry enough to burn vs not dry enough to burn. There is a gradient and where different types of vegetation fall along that gradient greatly affects the outcome of the fires. The other item to consider when we enter into the peak of the western wildfire season is our response to fires has greatly improved. But, as we have seen, the worst wildfires are when there is a confluence of events that occur. These often involve some very strong winds and often the response cannot be fast enough as the weather conditions often prevent a fast response.
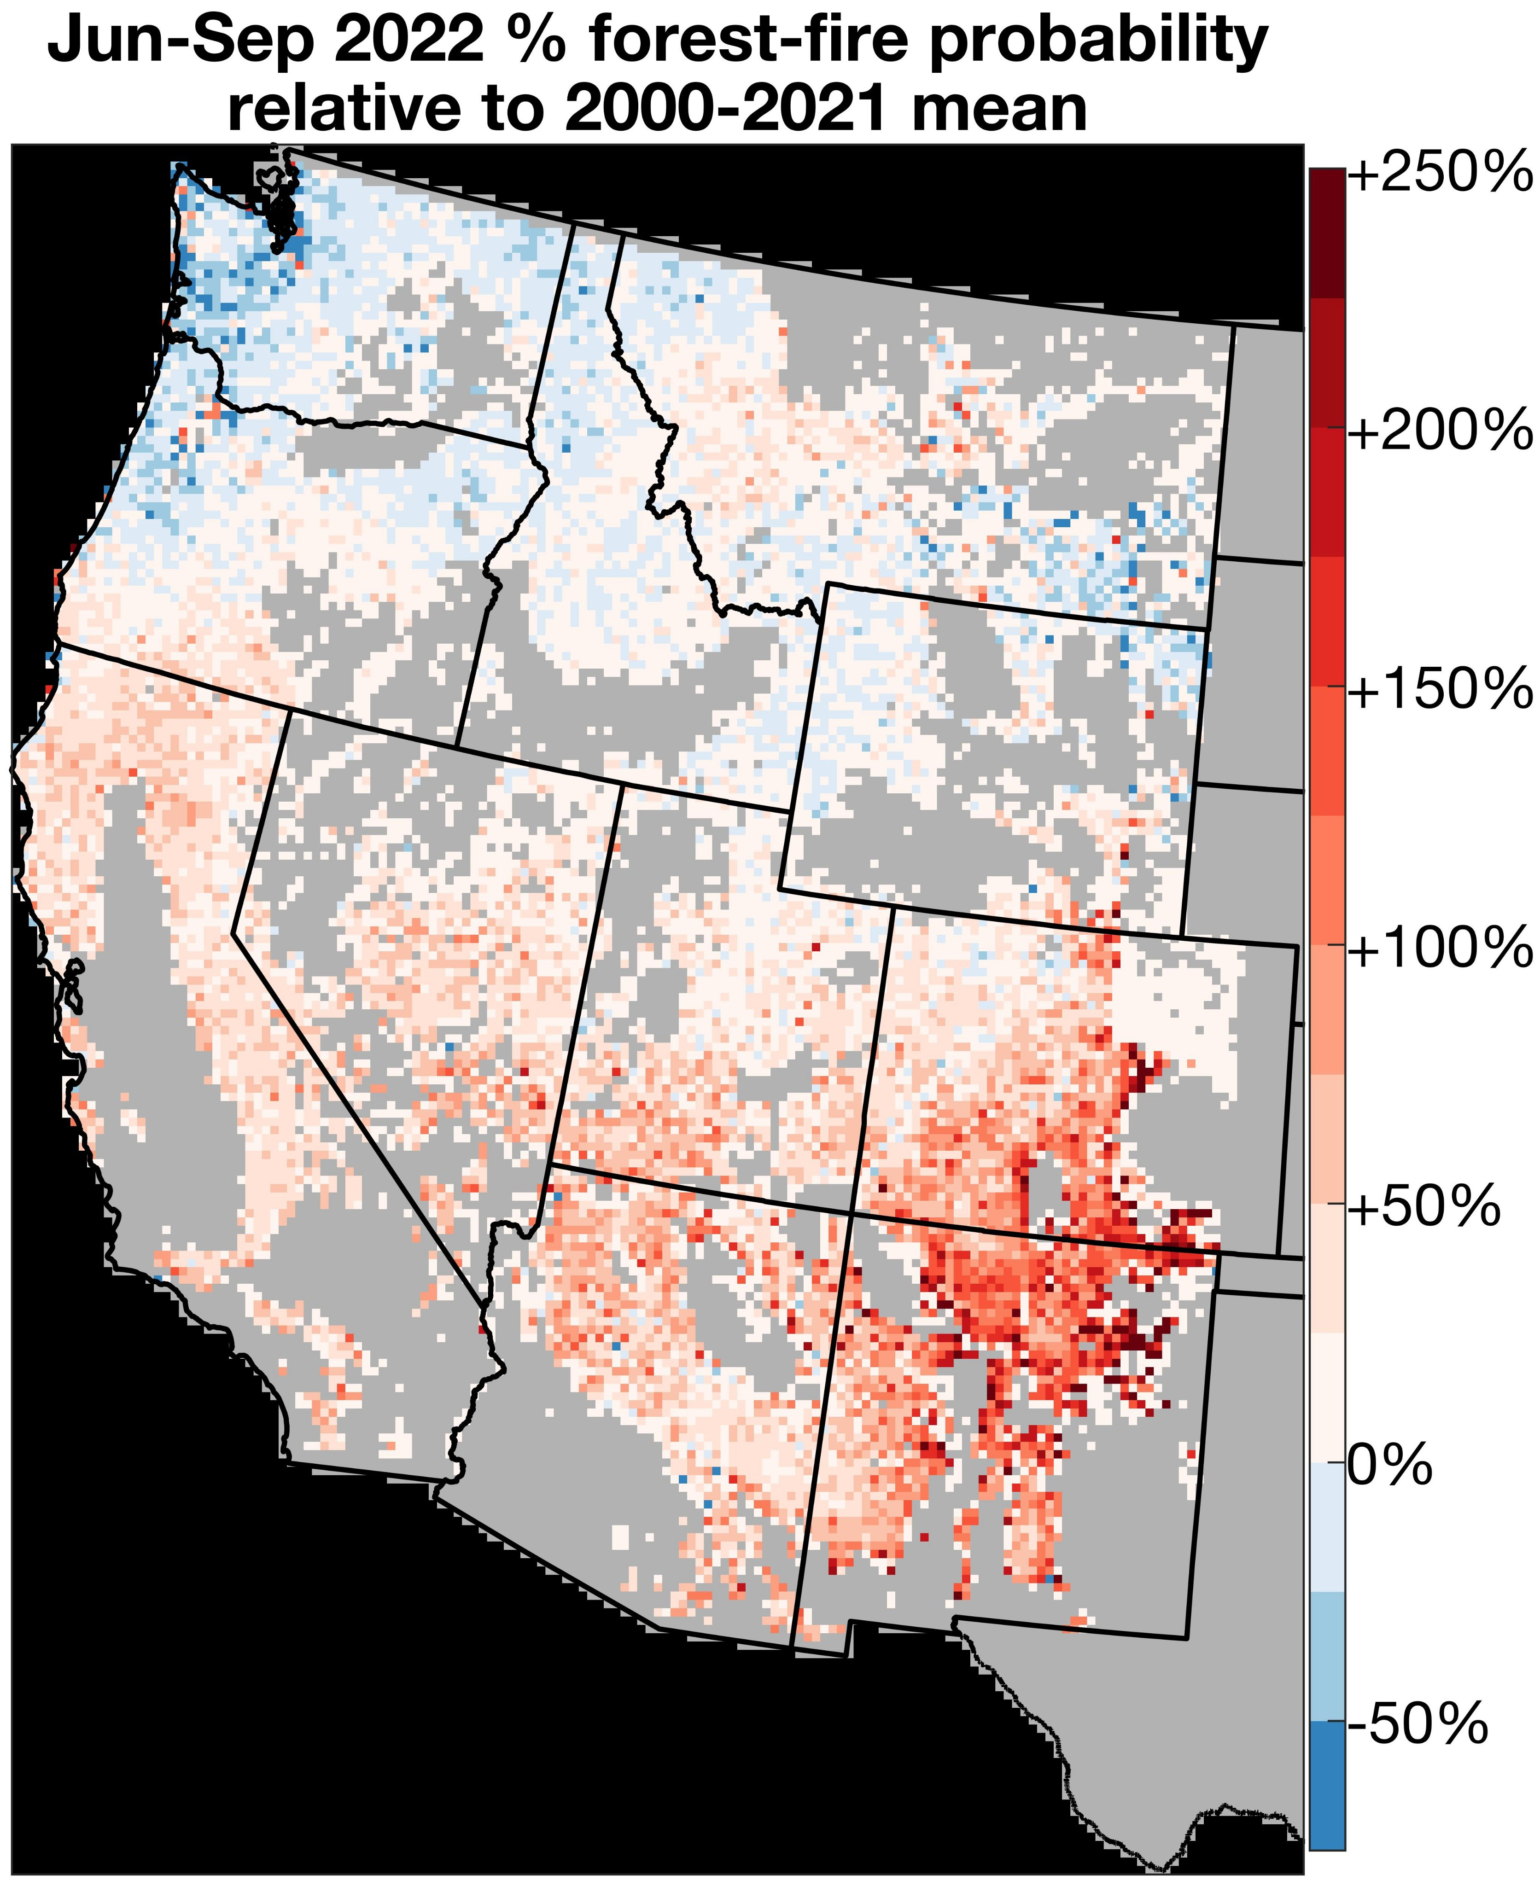
The most updated wildfire prediction can be found from the National Interagency Coordination Center as well as the local state-level fire agencies like Cal Fire. There is also promising work coming out of academia. An example of this is the work coming from Winslow Hansen at Cary Inst for Ecosystem Studies and Park Williams at UCLA, which have developed a seasonal forest ecosystem wildfire prediction model. Below is this summer’s forecast of wildfire probability relative to the average summer of 2000-2021.

Has Named Storms Gone Mad?
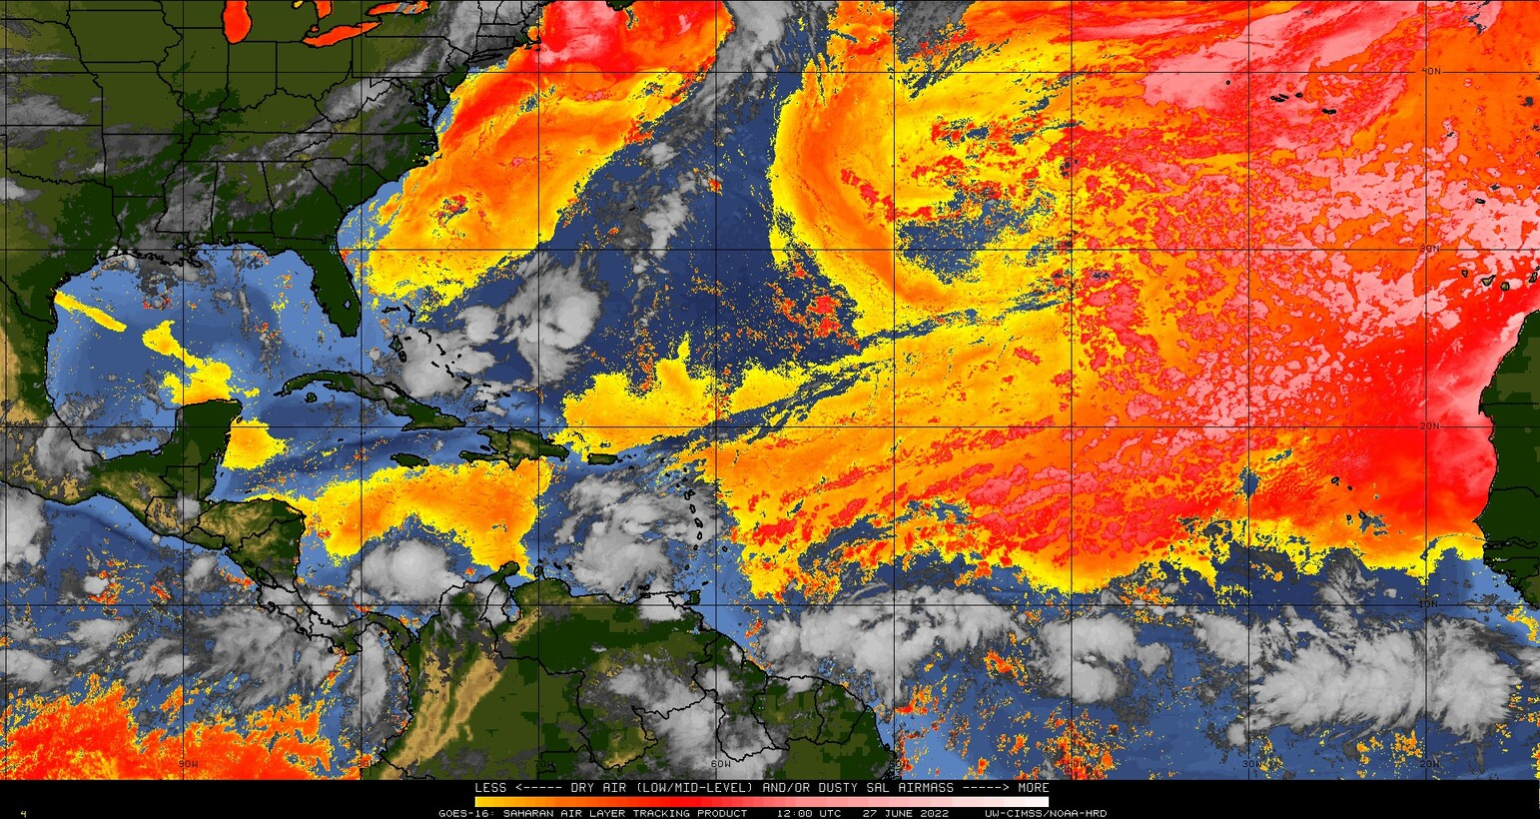
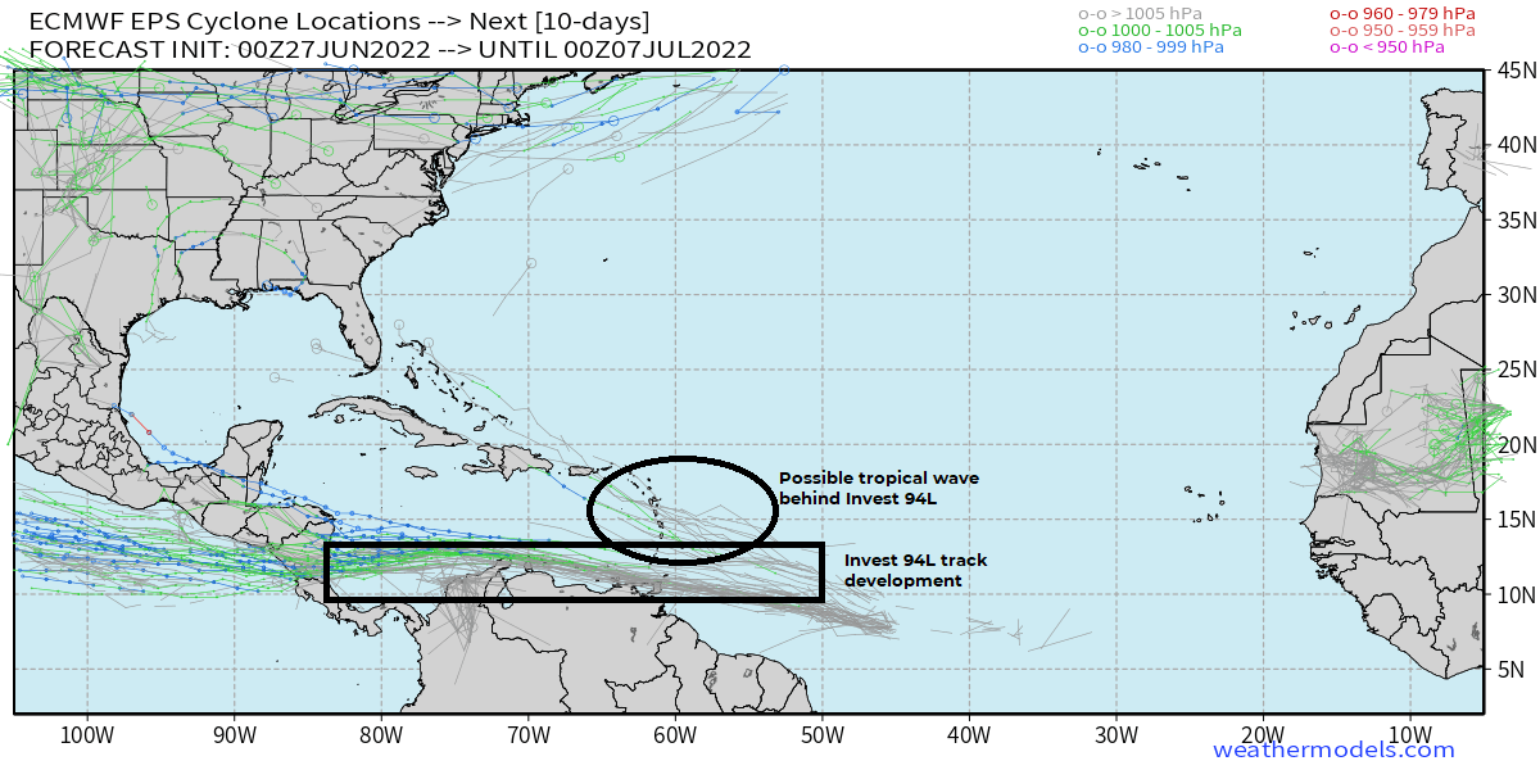
Mother Nature has seemed to be rather calm regarding the tropics as globally tropical cyclone activity is about normal and the Atlantic Basin has only seen one short-lived named storm so far, Alex from June 5th – June 6th. Over the last 50-years of records, the average date of the second named storm formation is July 24th in the Atlantic Basin. However, according to the National Hurricane Center, there is a strong easterly wave moving across the Main Development Region of the Atlantic. This is currently labeled Invest 94L and has a 90% chance of development over the next 5 days. Invest 94L is tracking over warm 28°C sea surface temperatures. A rough rule of thumb is that tropical cyclones can develop and intensify with ocean temperatures of 26°C or above, and the warmer it is, the more energy they have to work with. One of the big reasons these African easterly waves do not usually start developing so early off the coast of Africa and in the month of June is the area is still likely experiencing large amounts of dry dusty air that covers the deep tropics. This type of air mass often causes tropical convection to be suppressed, However, Invest 94L is at a really low latitude, so it's well south of the dry dusty air mass covering much of the Central Atlantic. Should Invest 94L turn into a named storm, the next name on the Atlantic storm list is Bonnie.

Overall forecast models are in good agreement on it developing Invest 94L into a named storm as it continues on a track west-northwest for at least the next five days. At this rate, it would reach the Windward Islands sometime around June 29th, possibly as a tropical storm. Beyond that, the uncertainty naturally increases substantially, but it should remain in the Caribbean for a few days and likely track into Central America if it can stay together, as sometimes storms struggle in the south-central Caribbean. We have plenty of time to watch the development, and at this time it does not look like a major impact on the insurance industry and most importantly not a cause for anyone to lose sleep or have to work long hours in the U.S. July 4th long weekend. The only concern at this time is the already active intertropical convergence zone which will move north in the coming months providing a more favorable environment for named storm development regardless of the dry dusty air. However, the current activity will turn quiet early - mid-July as the favorable MJO phase will slowly slide out of the Atlantic Basin which is more good news, but it's a long season that still does not peak until early September.

Has Mother Nature Gone Mad?
Extreme weather has always occurred and will continue to occur in the future. We are in our third year of La Niña in the Central Pacific and overall insured losses in the U.S. and Worldwide tend to be more extreme during La Niña events than El Niño events. La Niña amplifies U.S. severe weather, hurricane activity, and different rainfall patterns. Therefore, what the insurance industry is experiencing is likely partly caused by La Niña.
The bottom line is there are a lot of complexities ongoing in the insurance industry and 2022 is likely going to be yet again a costly year to muddy the waters. The question remains is what else might fill out the 2022 bingo card. Only Mother Nature knows and we will have to wait and see what she delivers, but these BMS Insights along with Pathlight AnalyticsTM will be here to provide answers, not output to what is going on.
