

Idalia has officially made landfall and, with that, history. It fills a large absence of major hurricanes to ever make landfall within the Apalachee Bay of the Big Bend region of Florida's west coast. No major hurricane on record (1851-present) is known to have made landfall in the region Hurricane Idalia has. Closest storm from the west - Michael 2018. Closest storm from the east - a hurricane in 1895.

In this BMS Tropical Update, we look at some essential observations as to how Hurricane Idalia's landfall will impact the insurance industry. Hopefully, readers are not surprised or caught off guard by a Category 4 upgrade of Idalia in the early morning hours. A high-end Cat 3 or low Cat 4 is functionally the same. We have had several days of watching and warning. In this case, the computer models seem to be highly accurate, and human forecasters at the National Hurricane Center (NHC) have also been excellent.
Landfall: 7:45 am EDT near Keaton Beach, FL, which is part of Taylor County, FL, with a population of 21,000 residents and a population density of 21 per square mile. This is important from an exposure concentration standpoint.
Pressure: 949 mb
Maximum Wind 1-min Speed: 125 mph (This a Category 3)
Wind Speed Observations: Around the time of landfall, a C-MAN station at Keaton Beach, Florida, measured sustained winds of 61 mph, with a gust to 77 mph. A Florida Coastal Monitoring Program tower located southwest of Hampton Springs, Florida, recently reported a wind gust of 68 mph.
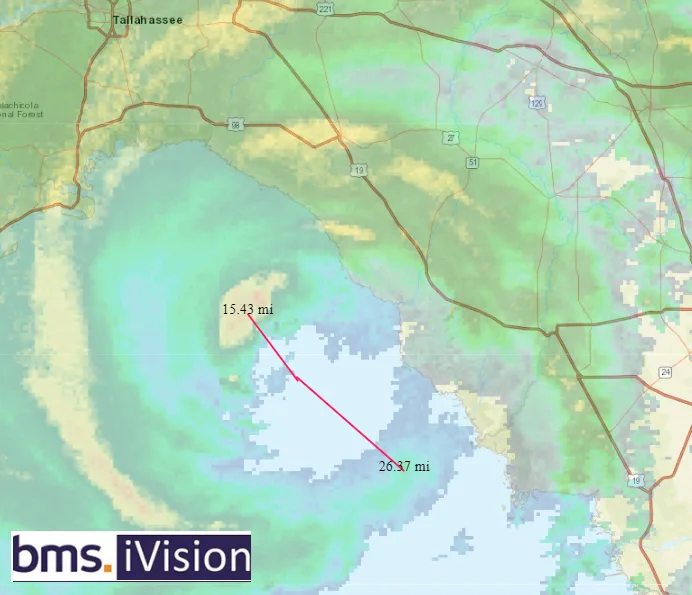
The radius of Maximum wind (Rmax): (Difficult to determine due to eyewall replacement cycle. (15 miles to 20 miles)
Forward Motion: 18 mph
As a reminder, the maximum sustained winds only occur in a small area of the eyewall, and the landfall areas are sparsely populated. It should also be noted that the hurricane intensity issued by the hurricane rarely will be verified by a weather station, so it is not a surprise that wind gusts are well below what has been stated by the National Hurricane Center.
The wind decays once it moves inland due to the frictional effects of the land surface. The radar imagery right before Idalia made landfall shows that it had started undergoing an eyewall replacement cycle with some dry air entrainment. This means that there was likely a pause and weakening in the strengthening that was occurring, which is largely why Hurricane Idalia made landfall as a Category 3 hurricane.
The eyewall replacement also means that the relatively small wind field had expanded, but the land surface's frictional effect allowed the wind field to contract. Leading up to landfall, Idalia had a relatively compact wind field. At 6:00 am, Idalia was 55 miles west-northwest of Ceder Key, yet weather station data on the island was only reporting winds of 41 mph with gusts of 47 mph, while the core winds of Idalia had sustained winds of 130 mph. To the west side of Idalia, data showed that at Alligator Point, FL, the wind was only gusting to 60 mph, 40 miles west of the center of Idalia. This means that the wind field was very narrow. It is similar to the wind field from Hurricane Charley 2004, which was narrow and intense.
Over the last few days, there has been a lot of focus in the media and these updates on the Tampa Bay Region. However, the wind gust at the airport never gusted above 60 mph. A review of most weather stations in the area shows that gusts only occur into the 50s over most weather stations. Thankfully, this should not cause much property damage to the region.

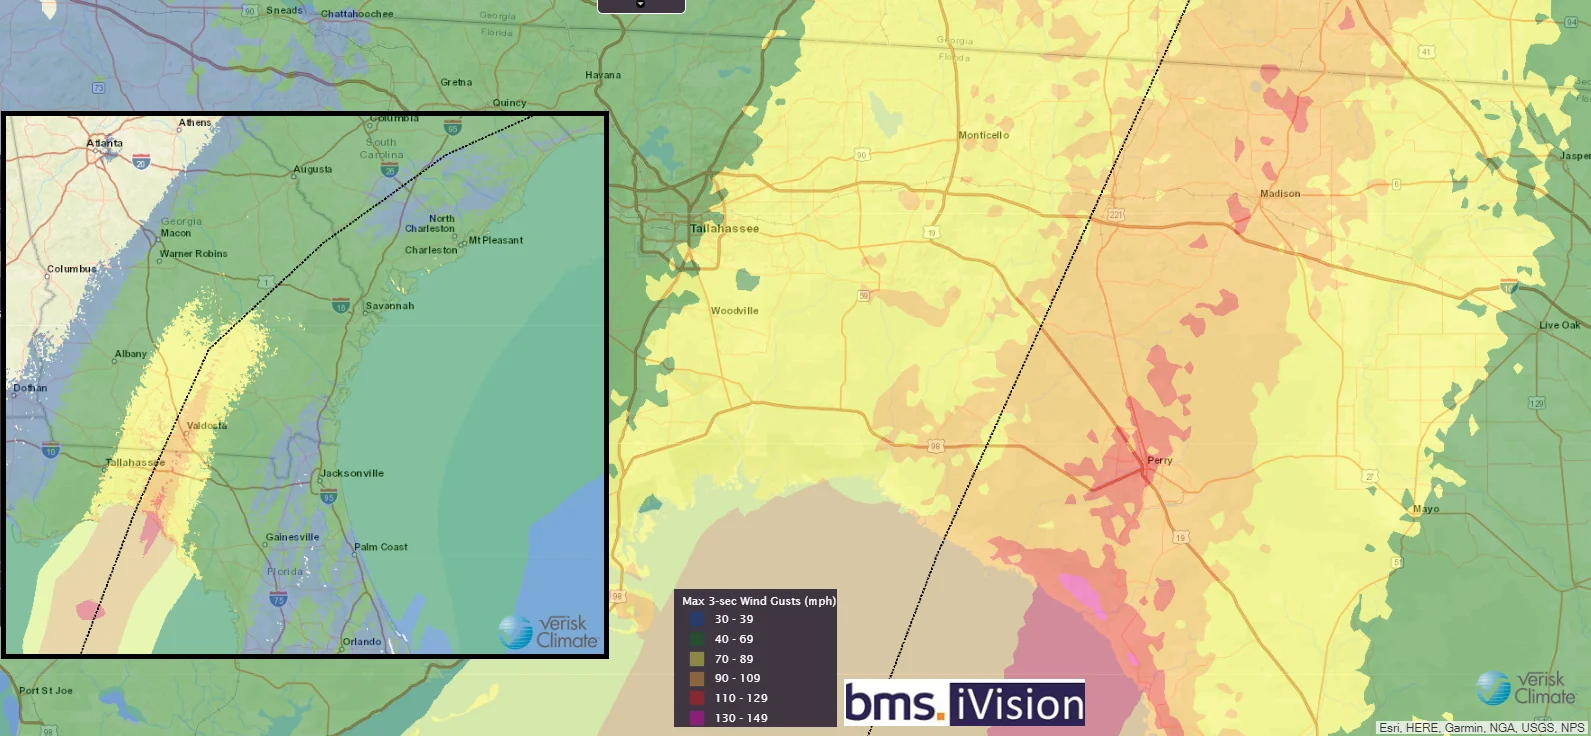
As mentioned, the wildcard equating to more considerable insurance industry loss would be the wind impacts on the Tallahassee area, which is one of the largest population centers in the area of Idalia landfall. The general area has an extensive tree canopy with predominantly above-ground power lines. Power is routinely out for a week after Category 1 hurricanes, as Hurricane Hermine showed in 2016. Just like on the right side of the storm, it is again apparent that the wind field was relatively compact. Hopefully, this means that Tallahassee areas will see wind gusts under 65 mph, limiting property damage in this region as well.
With a small wind field like Hurricane Charley 2004, the gradient in wind damage will be tight. However, according to the Insurance Institute for Business and Home Safety (IBHS), the Big Bend region has the lowest design wind speed of any section of the coastal area in Florida. Building codes are set at 130 mph 3-second gust; from what is being measured, the winds should be below this threshold. As we have mentioned, the immediate landfall area is sparsely populated. According to the IBHS, over 50% of homes in the Big Bend regions were built in the 1980s and 1990s, which was before the modern codes were established. In fact, the most common building type in the landfall areas is single-family manufactured homes. Furthermore, the IBHS studies have shown that asphalt shingle roofs that are older than 10 years, with gusts 90-100 mph, would see about 50% damage. Over 110 mph roof damage is a given, and water will likely come in through the damaged roof cover. All of these factors need to be considered when understanding the impacts of Idalia. However, observation shows that the heaviest wind damage will be fairly localized.
Storm Surge Observations
There has been ample mention regarding how severe the storm surge would be. Still, here we have highlighted that the sections expected to experience the highest storm surge are sparsely populated. Much of the population is inland, away from the storm surge zone, because these locations are higher in elevation. To date, these updates have not discussed that the overall area has a low take-up rate of flood insurance. Taylor, Dixie, and Levy counties generally have a take-up rate of flood insurance of only about 5%, and inland counties are less than 3%. Therefore, any coastal flooding and inland flooding could lead to a protection gap as most flooding at a location is likely uninsured, given these lower take-up rates. However, given the storm's forward speed, heavy flooding rains are not a big concern with Idalia's landfall.
Another important point about the storm surge is it is coinciding with an enhanced full moon tidal cyclone. Low tide in Apalachee Bay is between 8:00 to 10:00 AM, and high tide is 1:00 to 3:00 PM, so the early morning landfall was some good luck, all else equal.
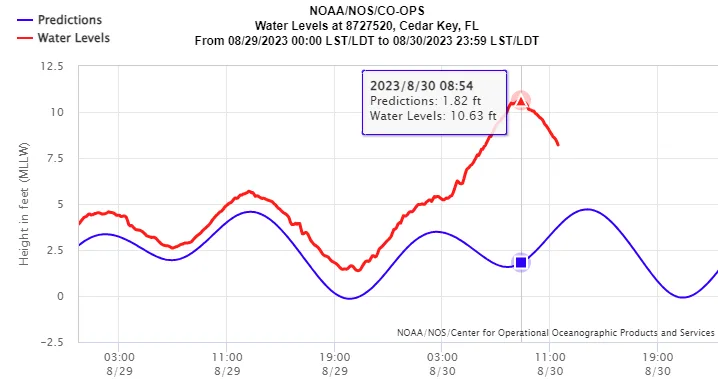
A NOAA National Ocean Service tide gauge at Cedar Key, Florida, recently reported a water level of 10.6 feet above mean higher high water, which approximates inundation in that area.
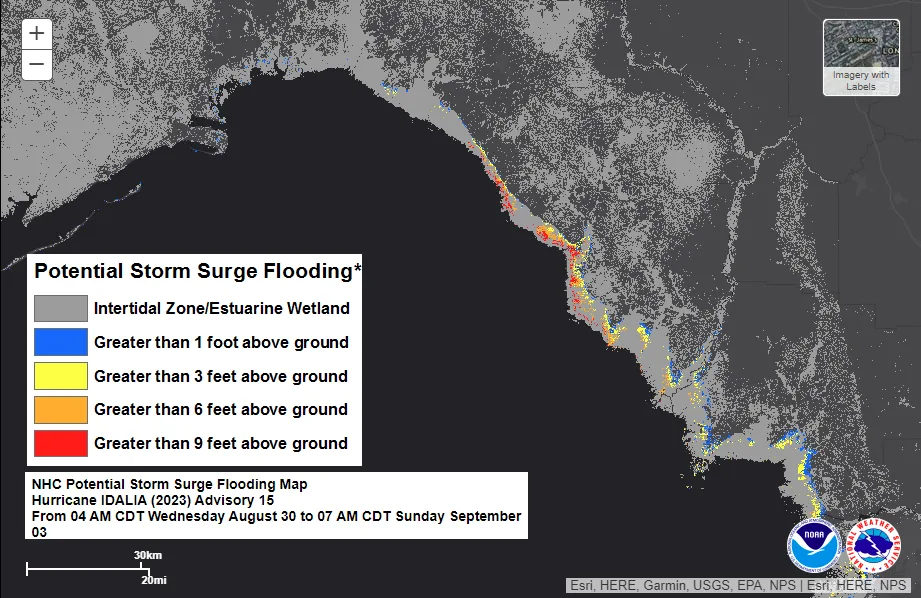
Storm surge has been reported along many locations on Gulf Blvd from Clearwater down to St. Pete Beach. As expected, storm surge has impacted Cedar Key, FL, Suwannee, FL, and Horseshoe Beach, FL, which are all tiny communities that are expected to see the highest storm surge. Due to the relatively small size of Idalia, it appears that the storm surge heights might not be as high as previously feared, with maximum storm surge heights just over 9 feet.
Inland Impacts
For points inland, Georgia and South Carolina will likely see, once again, a narrow area of higher tree damage with limbs down that could enhance power outages. Overall, the inland impacts will be fairly typical, with the most significant issues in inland flooding and coastal flooding as Idalia interacts with a frontal boundary. Again, full moon tide could enhance coastal flooding along the coastline, but it appears that the coastal flooding will be several feet below the levels seen in those previous disasters.
Discuss Rapid Intensification
As expected, Idalia rapidly intensified over 24 hours. Idalia went from a 981 mb 75 mph storm to a pressure of 940 mb and 130 mph sustained 1 min wind speed.
The insurance industry likely read multiple stories in the press that storms are getting more robust, and more and more storms are experiencing rapid intensification. Ian did this last year, and now Idalia and Franklin are examples of rapid intensification this year, so there is an upward trend of these storms that rapidly intensify. The plot clearly shows this, but what the plot does not show is some of the data nuances.

The data showing rapidly intensifying storms often started in the late 1960s when satellites became available. We know satellite technology and our ability to send more satellites into space has changed drastically. Therefore, the modern methods of measuring satellite winds did not exist 20 years ago. We also did not have aircraft GPS 20 years ago. Aircraft GPS dropsondes were not available until 1998, which is interesting because, in the plots below, there is an uptick of these rapid intensification events after 1998. The newest way to measure windspeed via satellite did not start until 2007, again showing another uptick in rapid intensification events. Our observations of hurricanes and the ability to capture these rapid intensification events will improve. This is because there is a good chance that drone (sUAS) small Uncrewed Aircraft Systems will likely be deployed into hurricanes. These sUAS have an 8-foot wingspan weighing 24.5 lbs and can fly for 2+ hours at a range of 275 miles. One was deployed in Ian last year, which collected temperature, pressure, moisture values, and wind speed. The drone was directed into the eyewall, where it completed a series of circumnavigations at different altitudes. At less than 2,300 feet above the sea surface, the UAS recorded winds over 187 kts (216 mph) and descended to as low as 200 feet at one point. A typical Hurricane Hunter flies at 10,000 ft.
The point is that we are getting better observation, allowing us to observe things we could not observe in the past. Hurricanes are rapidly intensifying more often, but keep in mind that how we measure this has been changing within a relatively short period of record. This is an area of research that the insurance industry needs to watch.
Summary
An event like this has never happened before in the Big Bend Region of Florida, so there is a bit of uncertainty. We know the wind swath will be narrow, and extreme damage will be limited to a small area. Live chaser videos do not show a lot of significant damage in the landfall areas. With higher named storm deductibles, some losses might fall on policyholders. Overall losses should be below most carrier cat programs, so this will not be a reinsurance event as insurance companies retain the losses. Many factors seem to be coming together to limit overall insurance industry losses. Still, the general uncertainty about how the building stock will perform, the size of the wind field, and the inland impacts are why BMS Re feels comfortable with the range provided yesterday of an insured loss between $3B and $6B. Still, the lower end of that range is more likely. This is not the devastating event that was feared even 24 hours ago.


