Focusing on Landfalls
The insurance industry has an obsession with Atlantic Basin seasonal hurricane forecast numbers. Around this time of year, at the start of the Atlantic Hurricane season, June 1st, before the hurricane season kicks into high gear, which is often mid-August in any given season, there seems to be almost weekly insurance industry news items related to the overall activity expected during the season. These forecasts are a dime a dozen, with 33 different entities producing estimates for the Atlantic hurricane season. It is these forecasts that generate headlines and prompt reactions from the insurance industry.
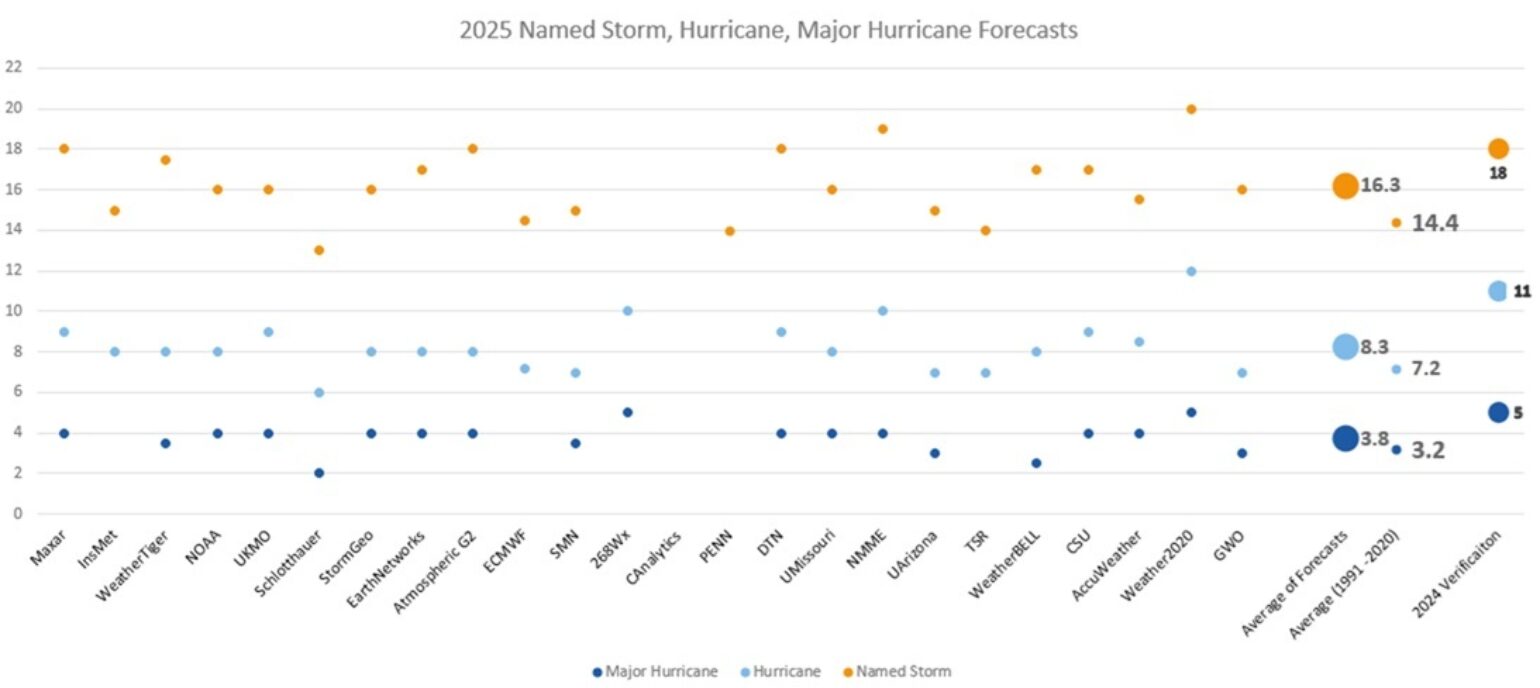
Above are the various number forecasts issued thus far from 24 different forecast entities. As collected by the Barcelona Supercomputing Center. By averaging the numbers across the different forecasts for named storms (16.3), hurricanes (8.3), and major hurricanes (3.8), the totals are lower than last year's observed hyperactive counts. (NS (18), HU(11), MH (5)) and above the 30-year average (NS (14.4, HU (7.2), MH (3.2)).
While it’s tempting to develop a risk strategy for these seasonal storm counts, the insurance industry must ask a sharper question. Will those storms actually make landfall—and if so, where? This is where we need to push the science while avoiding irresponsible forecasts. This is not easy, which is why most forecasts fail to even attempt a forecast of landfall, besides the known fact that if you have a higher number of storms that are forecasted, there is a higher likelihood of landfall, and that in any given year, Florida has the highest risk of a named storm landfall due to its geographic location and exposure along its coastline.
Overall, the answer to landfalls is far more relevant to insurers than how many cyclones spin harmlessly across the central Atlantic. It’s landfall, not formation, that drives claims and profitability for the insurance industry. Yes, there is the notion that it only takes one hurricane in any given season. Think back to 1992: a meager season by storm count (ten named storms), but Category 5 Hurricane Andrew changed everything, from building codes to how the industry models risk. This distinction between storm formation and landfall is critical. And while large-scale climate forcers influence the former with increasing forecast skill, landfall remains far less predictable, but still possible based on a few methods we outline below.
However, by now, you might have read one of the dozens of different forecasts that have been made public, which largely unpack several of the same climate forcers to come up with an educated guess on what some of the various forecast numbers shown above might be for this hurricane season. Each climate forcer plays a role in shaping basin-wide activity, yet can point to some hints at landfalls.
Sea Surface Temperatures (SSTs)
Warmer SSTs, particularly in the Main Development Region (MDR) between Africa and the Caribbean, fuel hurricane formation. Warm water increases the energy available to developing systems and supports the rapid intensification of these systems.
If you remember last year, the SSTs were record warm, which led to some very bullish seasonal forecasts, which mostly panned out in terms of overall activity and landfills.
This year SSTs are warmer than the 30-year average SSTs, but for the most part, well off the record warm SSTs of 2023 and 2024.
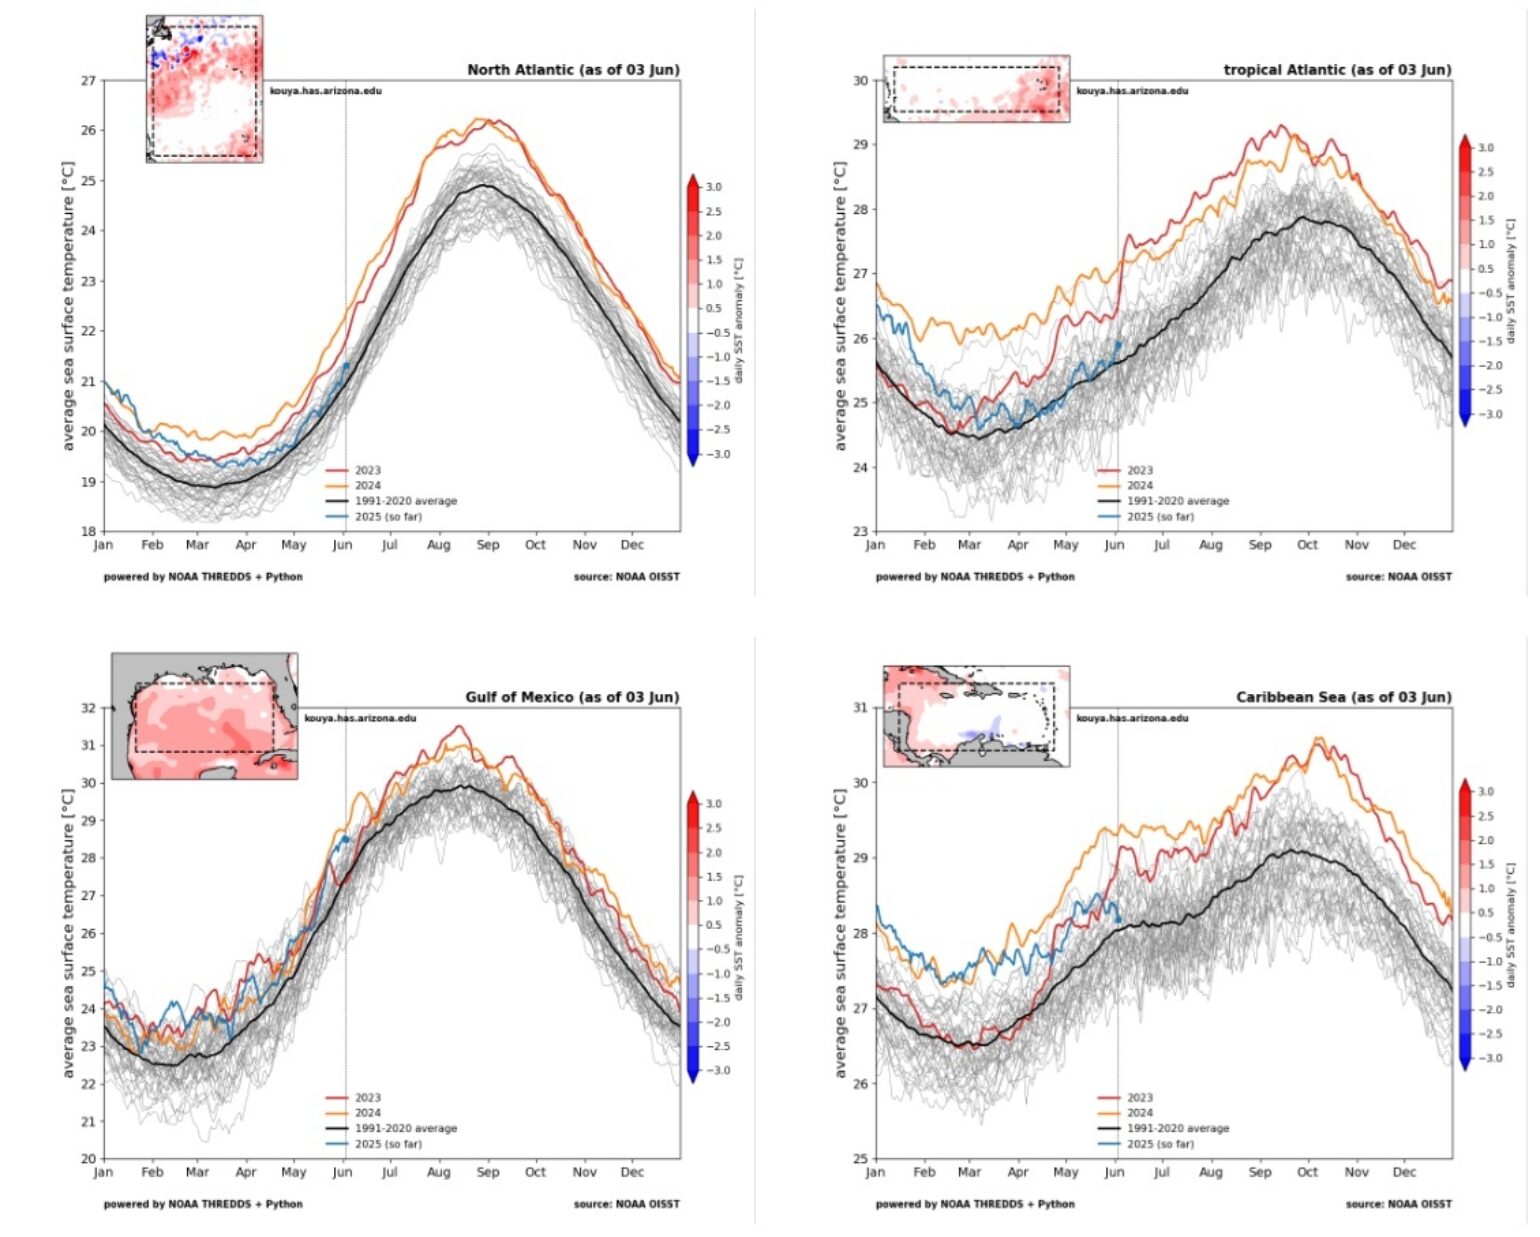
The plots above, courtesy of Kim Wood and the University of Arizona, show the area-averaged SST. The black line depicts the 1991-2020 long-term average. Thin gray lines correspond with individual years from 1982 through 2022. 2023 is plotted in red. 2024 is plotted in orange. 2025 (so far) is plotted in blue. Dashed box on inset map denotes region for area averaging. In all areas except the Gulf of Mexico (Lower left plot), the water is significantly colder but still above average. How these SSTs support landfall will be outlined later in the sections below.
El Niño and La Niña (ENSO)
For decades, ENSO has been recognized as a reliable climate forcer for Atlantic basin activity. However, for the first time since the spring of 2020, ENSO is in a relatively neutral state. Neither warm (El Niño) nor cold (La Niña). This is important in the overall basin forecast because El Niño tends to suppress Atlantic hurricane activity by increasing wind shear, hostile upper-level winds that tear storms apart. La Niña, on the other hand, reduces shear and allows storms to flourish. This year, however, ENSO complicated landfall forecasts.

The maps above shows landfalls during NOAA categorized La Nina, Neutral, and El Nino years. With the understanding that there are more ENSO neutral years than either La Nina or El Nino, one can see that El Nino years tend to suppress activity. La Niña, which enhances activity, results in more landfalls. However, this year the climate force is expected to be neutral to slightly La Niña, so an increase in landfalls should be expected based on ENSO neutral conditions.
Saharan Air Layer (SAL) and Dust
Another climate forcer that appears to be gaining more attention in recent years is dry, dusty air from Africa, which can suppress storm formation by stabilizing the atmosphere and reducing moisture. The SAL activity typically ramps up in mid-June and peaks from late June to mid-August, with new outbreaks occurring every three to five days. As seen just last year during the hyperactive 2024 season, the SAL contributed to a marked lull in tropical cyclone activity between August 20 and September 23, which is usually the peak time for most Atlantic hurricanes to form. However, soon after the dust settled (pun), the season bounced back with a record total of 11 named storms at the end of the season. Therefore, SAL can influence landfall, and after the peak of the season, North Africa and the Saharan were wetter than normal. This year, in examining the climate forecast models, below, they predict that North Africa could be drier than normal, potentially leading to more frequent dusty episodes. However, the long-term predictions in this region carry less weight and influence on seasonal landfall predictions. Still, the persistence of SAL into late summer could mean fewer landfalls overall.
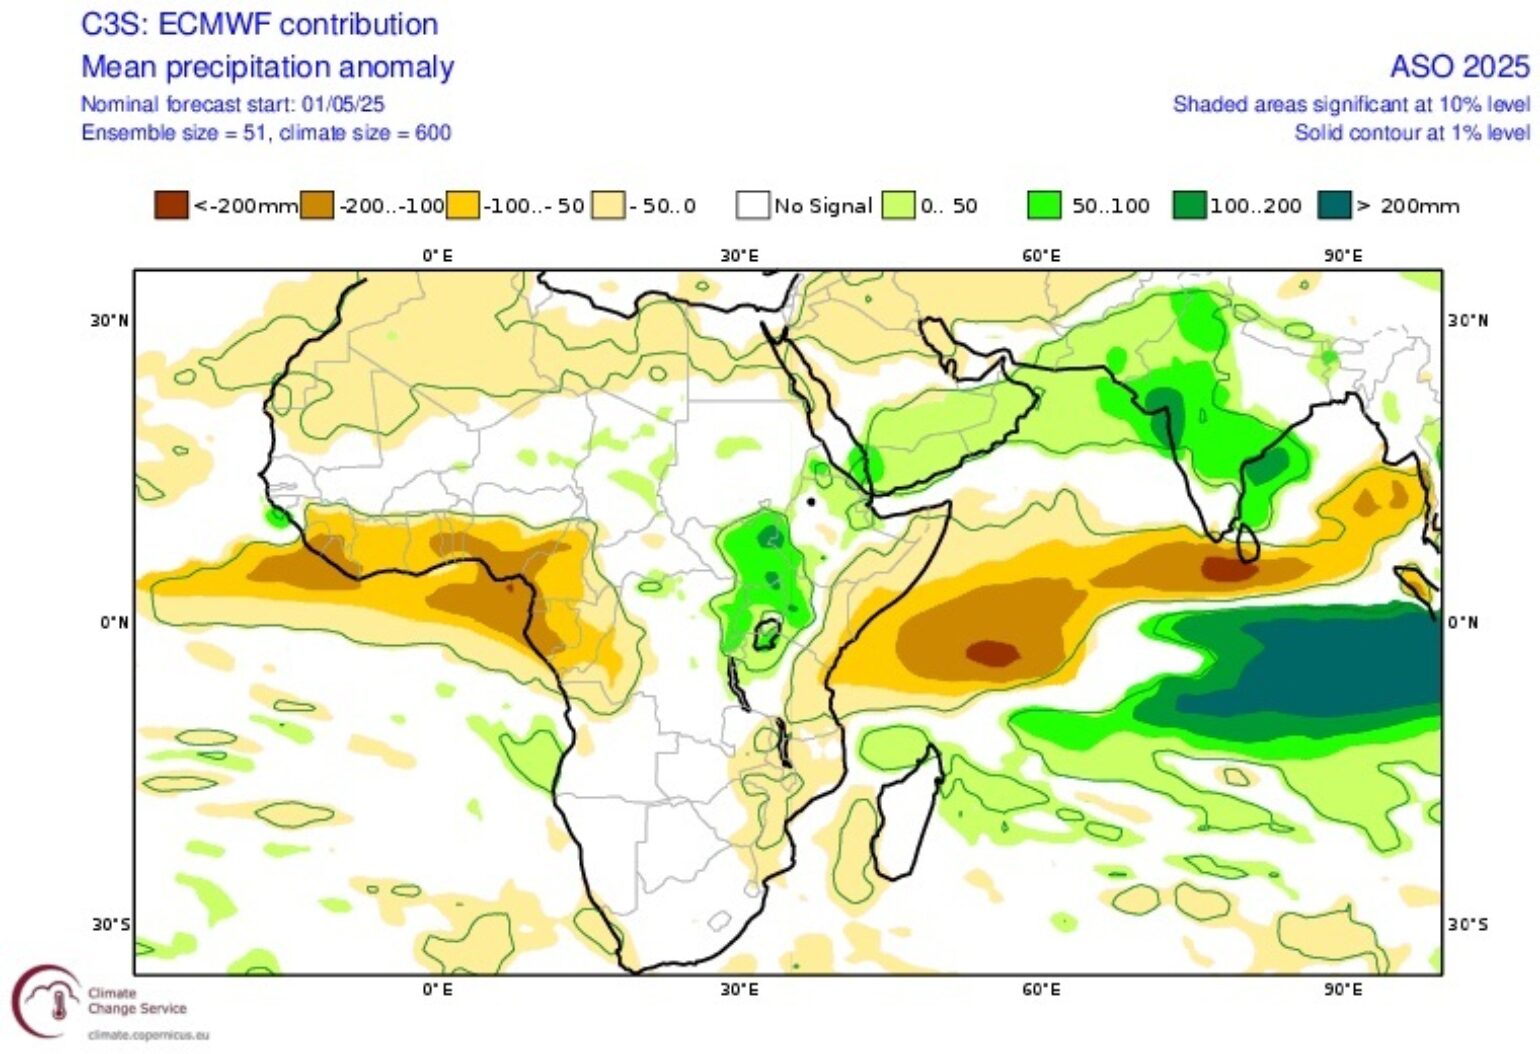
Above is the ECMWF Seasonal forecast issue in May for the August, September, and October time period, showing drier than normal conditions across North Africa, where dust tends to originate. This could limit some named storm development, with a greater emphasis on storms that develop closer to the U.S. coastline, thereby increasing the chances of landfall.
Madden-Julian Oscillation (MJO)
The MJO is a 30–60 day eastward-moving disturbance that enhances convection in the tropics. When the MJO is active over the Atlantic, storm formation tends to increase. This pattern affects when storms form during the season, but not necessarily where they go. The MJO has 8 phases, and in 2023, Phil Klotzbach examined the MJO's influence on landfalls, finding that phases 3 and 4 are associated with the greatest losses, with a higher proportion of landfalls along the Atlantic coastline and the Gulf of Mexico, as shown in the figure below.
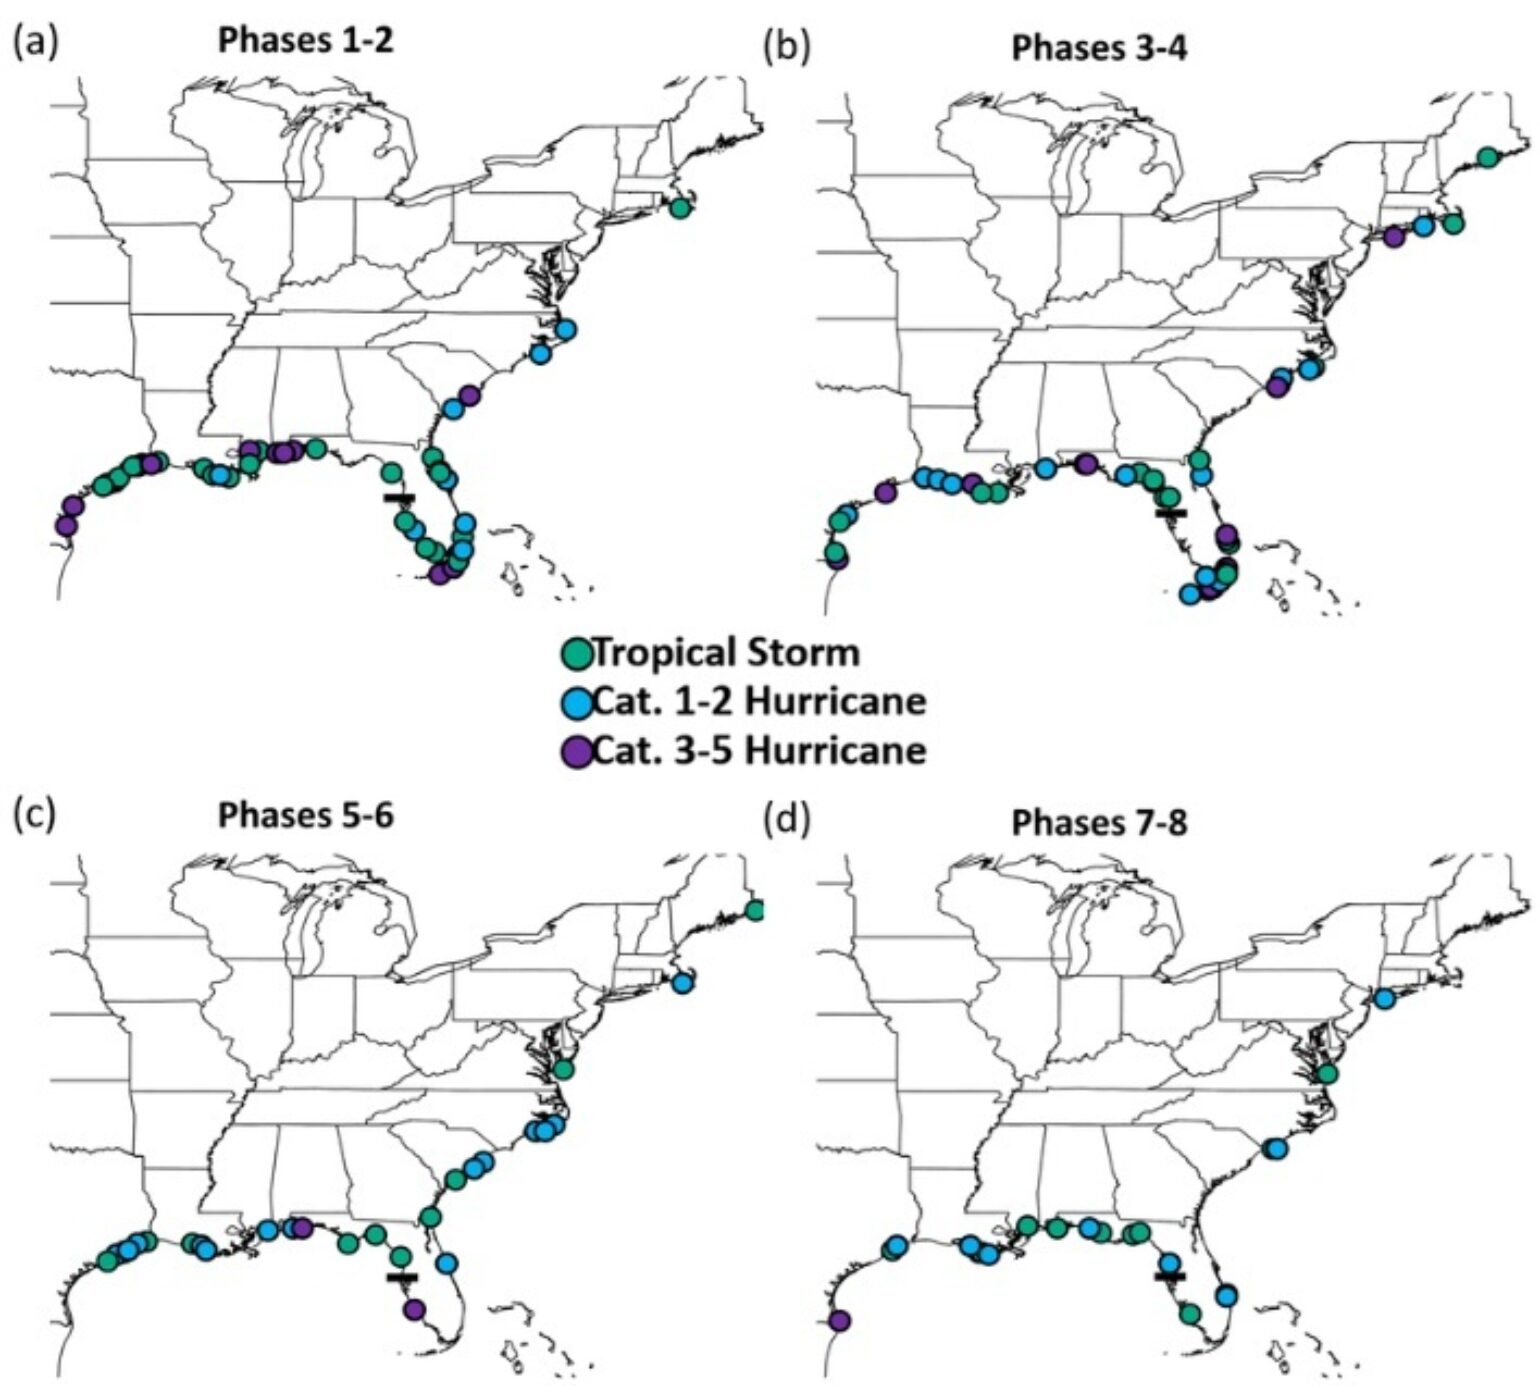
Unfortunately, the MJO is hard to predict on a seasonal scale for landfall. Still, for a subseasonal timeframe, it can be very useful for the insurance industry to understand when to be on watch for trouble formation and landfall potential.
Atlantic Multi-Decadal Oscillation (AMO)
This is a long-term cycle of ocean temperature fluctuations that can drive multi-decade periods of above- or below-normal storm activity. We’ve been in a generally active AMO phase since the mid-1990s. Some research suggests the AMO might not be so much of a natural oscillation, but since 1995, the basin has seen more landfalls as a result, and the base state of the AMO still suggests a higher probability of landfalls to occur.
For the Insurance Industry, Landfall Is the Signal
As mentioned above, nothing should be new to those who have read insurance media publications on what to expect this hurricane season. With a higher than normal number of named storms and hurricanes, the landfall probability is likely to be higher.
When it comes to landfall for the 2025 Atlantic hurricane season, two very important metrics should be at the back of the insurance industry's mind that represent unprecedented times when it comes to hurricane landfalls. Will the 2025 season establish a new record for U.S. Hurricane Strikes with the most consecutive seasons with at least one major hurricane (Cat 3-5) strike? A major hurricane has made landfall every year since 2020. The last time this occurred was between 1915 and 1919. This year could also break the record for the most consecutive seasons with at least one Category 2 or stronger hurricane strike, which has occurred since 2016. The last time this happened was between 1875 and 1883, so it is no doubt unprecedented and even more unusual, given the long period of no hurricanes between 2006 and 2015.
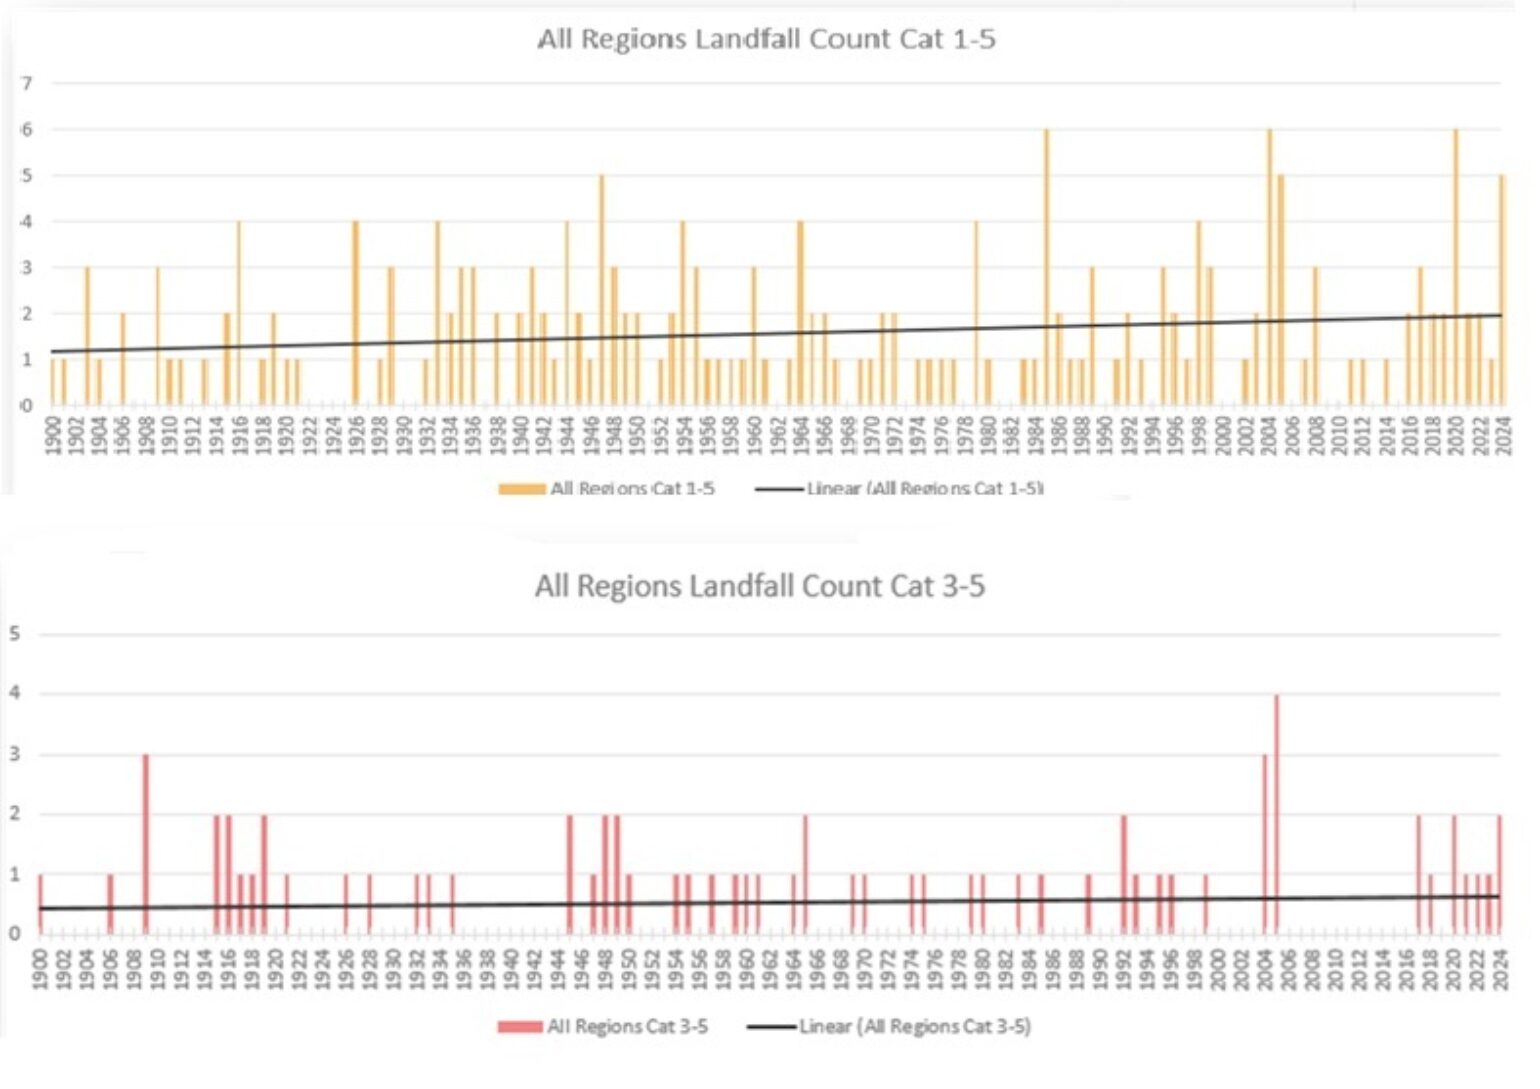
Highlighted above is the landfall of U.S. Hurricanes, which shows just how unprecedented the current streak of landfalls has been. Overall, in a given year, the U.S. coastline should experience about 1.8 landfalls per year.
Landfall forecasting is hard because landfall depends on shorter-term and regional-scale weather patterns, such as high-pressure ridges, troughs, and mid-latitude blocking systems, that can’t be reliably predicted months in advance. Still, this year's climate forcers, such as SST, and how they align with an analog year, can point to similar years. We can also examine other factors, such as atmospheric pattern analogs.
In looking at the SST anomaly, we can get an idea of what areas might see a higher track density across the basin. The top plot above looks at the last 30 days of SST anomaly, and which years best match those years, and where the storms tend to concentrate. In the top plot, the red areas with higher track density are off the Southeast U.S. and off the Yucatan Peninsula.
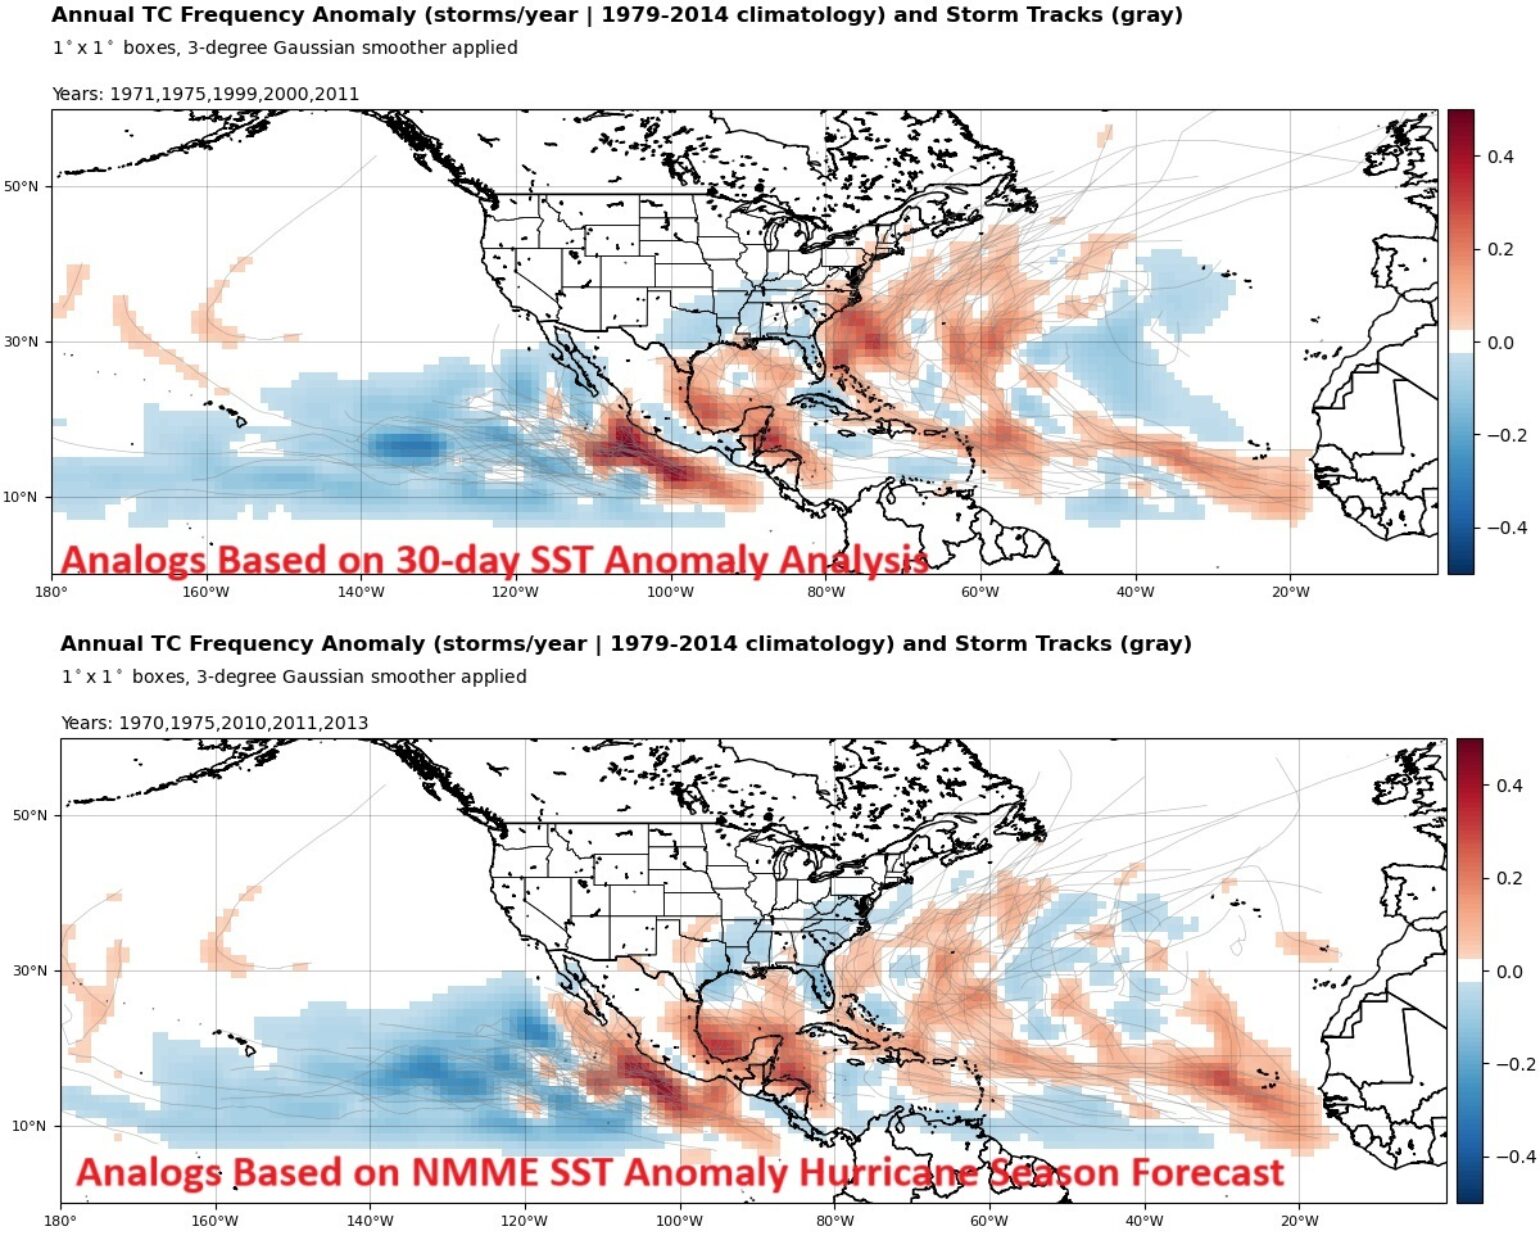
In the plot above, the bottom track density plot is based on the forecast SST anomaly during the hurricane season, and which years best match that SST forecast pattern, and where the highest areas of track occurred. Similar to the upper plot, we see weaker areas of track density off the southeast coastline and an even greater concentration around the Yucatan Peninsula. The years selected in both plots above are also shown.
Another approach is to understand what might happen by examining atmospheric patterns and the state of the atmosphere during the hurricane season, based on those analogs. To do this, we can look not only at SST in the Atlantic and Pacific (ENSO) but also at other patterns, such as the North Atlantic Oscillation (NAO) and Pacific Decadal Oscillation (PDO), as well as factors like severe weather.
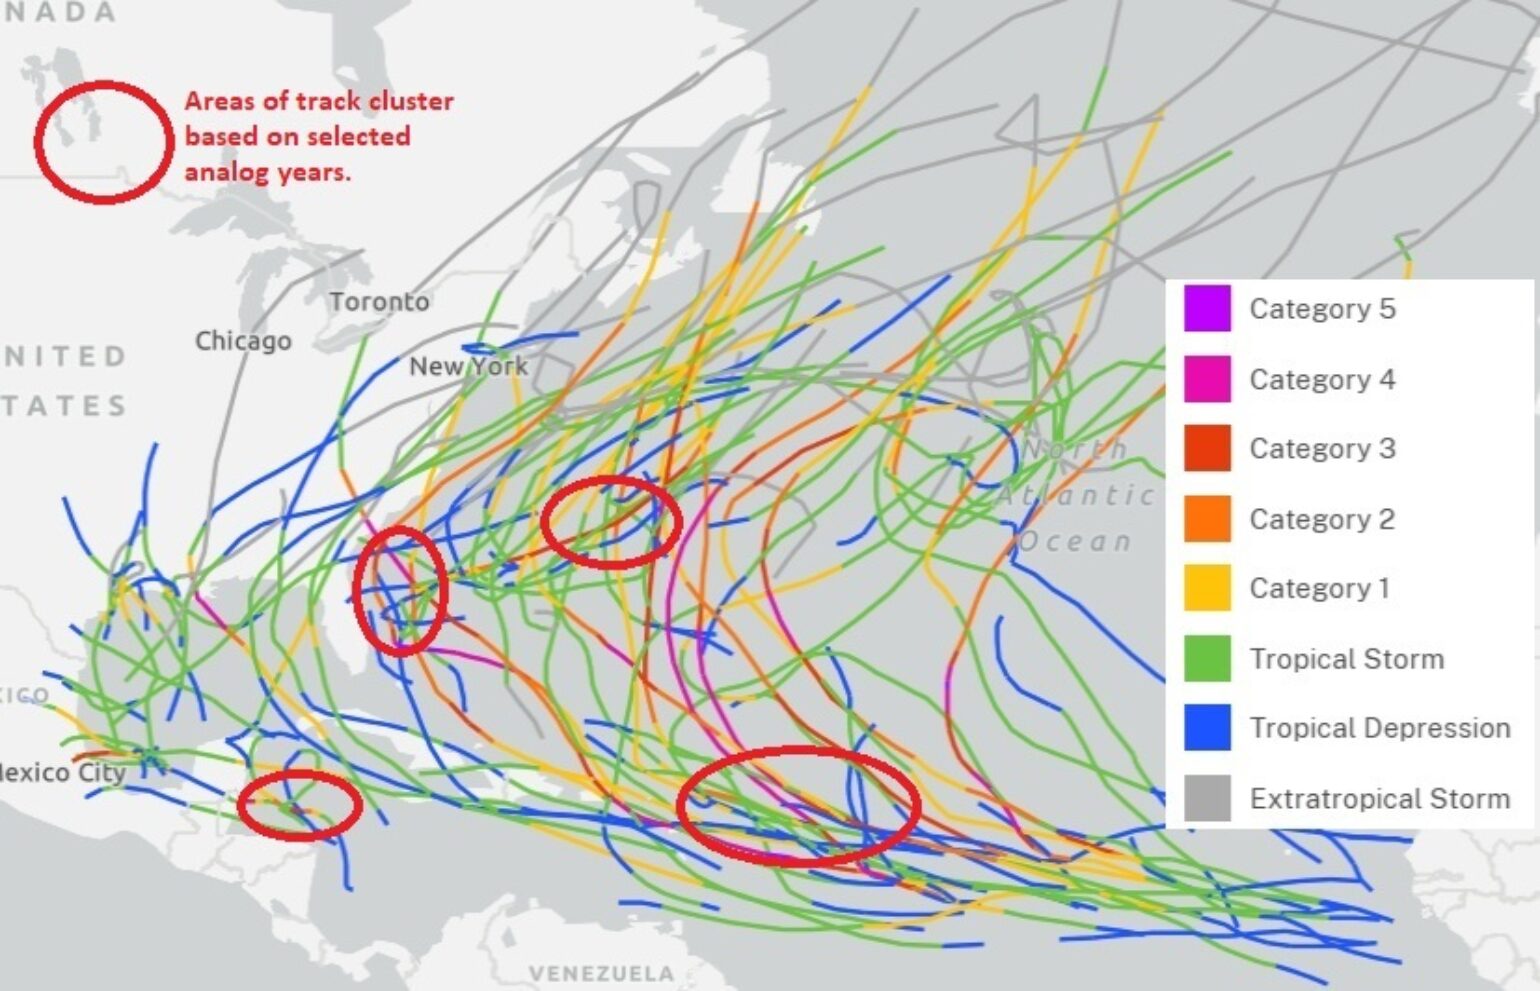
Based on this analysis, we get analog years of 1989, 2000, 2011, 2019, and 2021. They provide track clustering above, which interestingly enough has some of the same clustering as the SST anomaly in the previous image, so if added together, the insurance industry should be on the lookout for increased activity along the southeast coastline and around the Yucatan, which would open the door to a Gulf of Mexico landfall. Still, the exact landfall location will depend on the strength of the Bermuda High in August, which will determine the exact steering of storm tracks. If there is an upper-level trough over the eastern U.S., this could recurve storms out to sea. These steering currents change week-to-week, meaning timing is everything. Insurers and reinsurers must therefore distinguish between what drives activity and what drives loss, which is also critical to landfall location.
• Will a storm strike a major insured population center?
• Will it track into regions with high property concentration or infrastructure vulnerability?
• Will it cause storm surge in a low-lying urban area?
These are landfall-centric questions, and they should serve as the basis for exposure management, reinsurance strategy, and risk pricing.
As the insurance industry incorporates all the forecast numbers for this season, it is likely more important to track subseasonal shifts, such as the MJO and SAL, and assess changing landfall probabilities. It is recommended to de-emphasize storm counts and focus on stress tests and the use of realistic landfall scenarios instead of worst-case, basin-wide metrics. Focus on areas of high exposure concentration and plausible landfall scenarios. We know that a “quiet” season may not be low-risk—if the one landfall is in the wrong place, as the industry does not pay for storms that stay over water, it pays for landfalls.
