

BMS Tropical Update - Yo Soy El Niño
“I am El Niño! All other tropical storms must bow before El Niño! Yo soy El Niño! For those of you who don’t “habla Espanol”, El Niño is Spanish for.. The Niño! To any of you hurricanes who are listening, step on up! Because nobody can take El Niño! I challenge any of you punk-ass tropical storms to a no-holds barred cage match! Any time! Any coast! I swear to God all Mighty it is time to pay the piper, ’cause El Niño’s coming for ya! And it ain’t gonna be pretty!”

If you are old enough to remember, arguably one of the best Saturday Night Live (SNL) skits to be aired was during the extreme 1997 El Niño event in which El Niño became a household term. The late great comedian, Chris Farley, took advantage of this with a skit dressed as a professional wrestler named El Niño.
By now, you have likely seen media several mentions of an El Niño building in the Central Pacific Ocean. Once again, all hurricanes and tropical storms must bow to this global phenomenon, which is likely to reduce tropical named storms and hurricane formation in the Atlantic Basin due to increased wind shear, primarily in the Caribbean Sea. The problem, however, is that there is much more than El Niño to consider. Warmer than average Sea Surface Temperatures (SST) play a major role in enhancing named storm development. While the standard forecast of the expected number of hurricanes or named storms that might occur in the Atlantic basin during the hurricane season offers little value to the insurance industry, it receives plenty of media attention. This BMS Insight aims to push the knowledge of the upcoming season by providing ideas on where storms might track and what losses one might expect as a result.
With all the media hype around these early-season Atlantic Basin forecasts, it might be wise first to understand the overall skill of these early-season forecasts. Using the widely followed Colorado State University (CSU) forecasts, the correlation forecast skill for named storm frequency for April forecast from predictions made from 2010 – 2022 is just 0.42. This is an improvement on a longer period of record 2000 – 2022; so maybe in recent years, these forecasts are getting better, but they still are not as skilful as the June or August forecasts, which have a higher degree of accuracy.
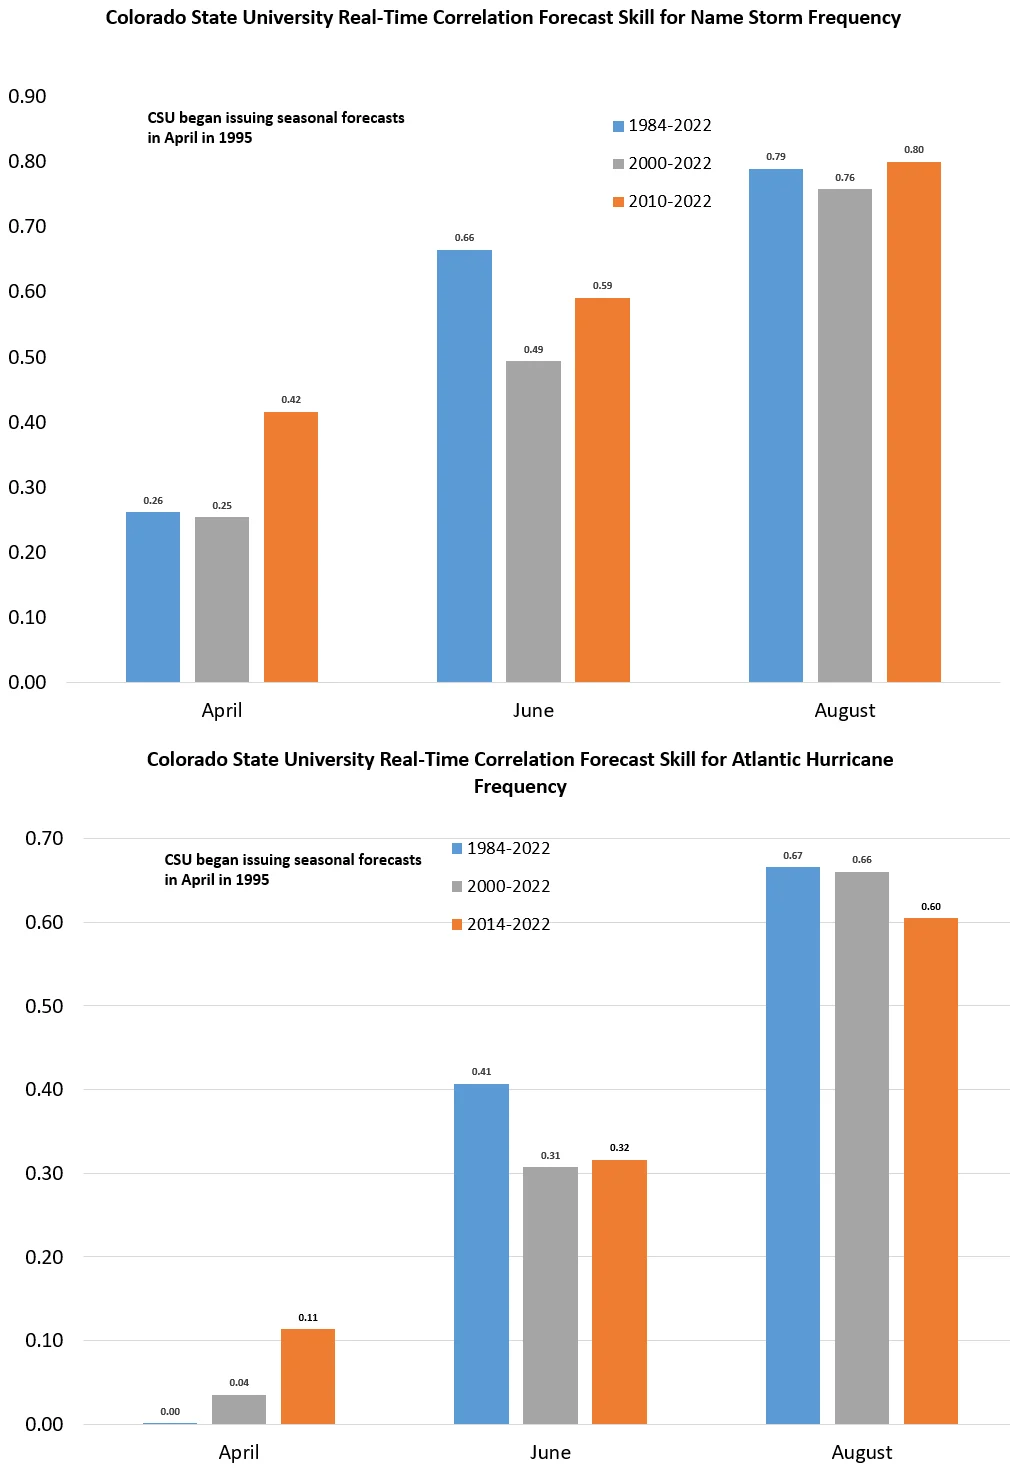
The hurricane forecasts skill shown in the bottom half of Figure 2 above is even worse for predicting hurricane frequency from CSU April forecasts. For the forecast period from 2010 – 2022, the correlation is just 0.11. However, this is again an improvement over the correlation using the longer period of record 2000 – 2022, which is 0.04. There is very little skill with these April forecasts, and the skill for named storm and hurricane forecasts really does not start to show up until the June forecasts are made. Moreover, August forecasts show much more skill than even the June forecast. Keeping in mid-August 20 is climatologically when there is an uptick in activity in the Atlantic Basin, as historical data shows that 50 percent of named storms, 57 percent of hurricanes, and 66 percent of major hurricanes form during the period of August 20 through October 10.
Still, suppose you want to follow these forecasts and know what other forecasts shops are predicting for the upcoming named storm season. In that case, they are a dime a dozen and tracked at the Barcelona Supercomputing Center. It keeps track of 29 different forecast shops that try to predict the number of named storms and hurricanes in the Atlantic basin each season. This year, the average of the forecasts submitted so far is 14.3 named storms, which is right at the 30-year average of storms to expect in the Atlantic Basin.

If El Niño is coming and, as Chris Farley says, hurricanes and named storms do not stand a chance against El Niño, then why are all the forecasts shown in Figure 3 averaging out to what might be an average season of activity? To answer this, we must look at the complete picture of the two major climate forcers, the El Niño and Atlantic Basin SST.
First, if you do not know what El Niño is: it is not a professional wrestler; it is the warming or cooling of the water in the Central Pacific. The NOAA description of it and its impacts can be found here.
Plenty of research exists on how El Niño Southern Oscillation (ENSO) impacts basin-wide activity. There is a clear signal of La Niña frequency being substantially higher than the neutral phase frequency. In turn, it is significantly higher than El Niño frequency, which limits hurricane development due to a higher degree of wind shear across the Tropical Atlantic. If there is one aspect that might not be highlighted as much is that the most severe Category 5 hurricanes do not fit this trend. The base these analyses are conducted from is already dealing with a low sample size, with only 29 Category 5 hurricanes recorded since 1950. It is possible that there have not been enough years of data to get a meaningful sample here. Still, given that, Category 3 and 4 hurricanes illustrate the same trend with fewer storms in El Niño, Chris Farley is correct. They are no match for El Niño, it seems.
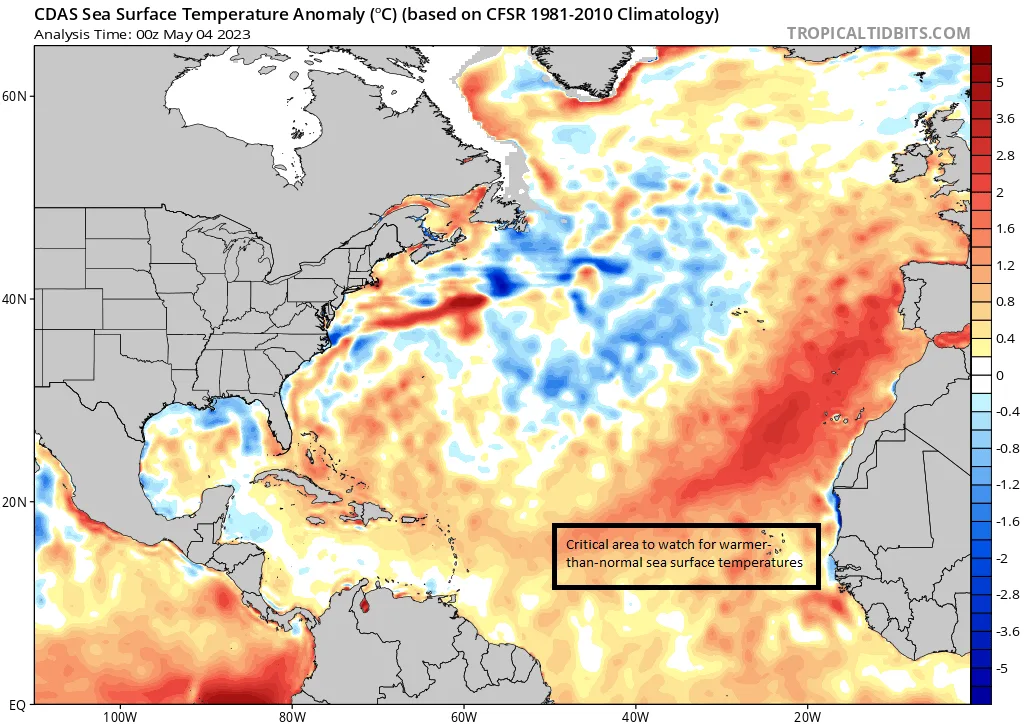
However, ENSO is only part of the equation in any given year. For example, the Atlantic Basin SST is trending warmer this year. Hence, this positive climate forcer would promote more name-storm activity in the Atlantic basin even if strong wind shear acts as a deterrent. This could be why in Figure 3, many forecast shows are still forecasting the hurricane season to be about average this season
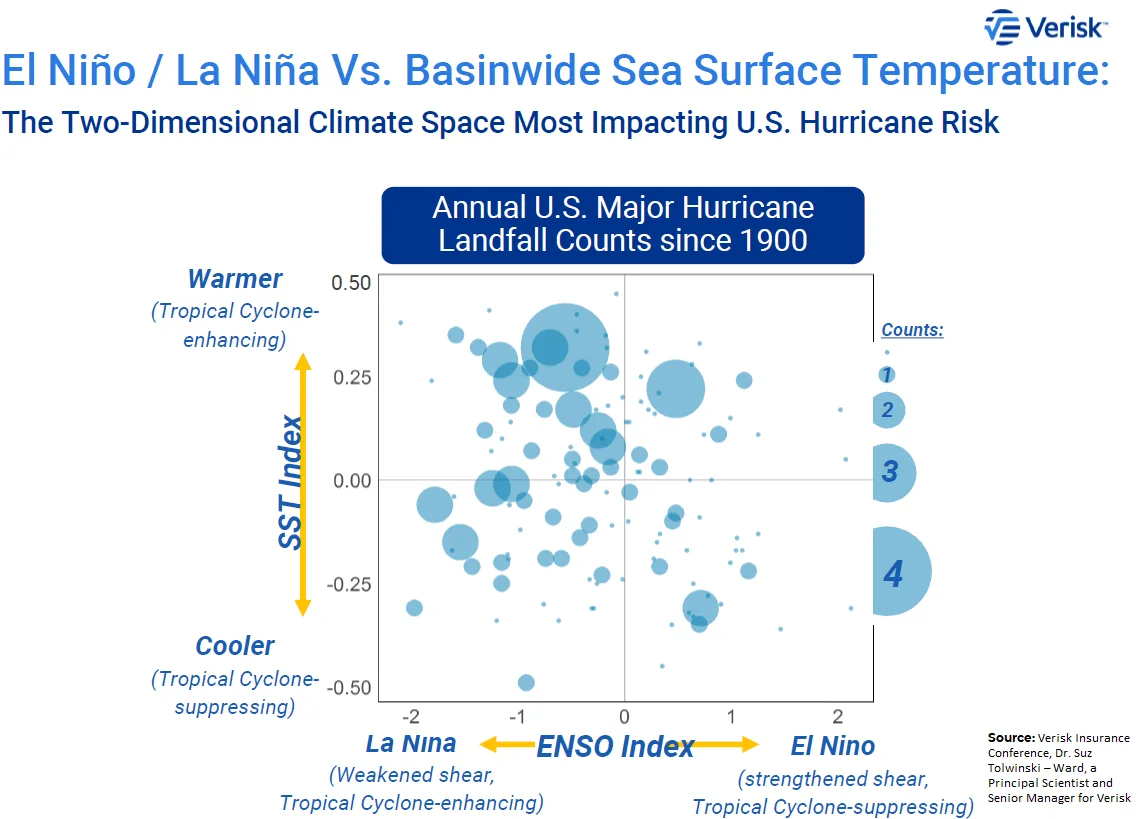
Landfalls and Tracks Are What MatterSeasonal forecasts need to add value beyond the number of named storms forming in the Atlantic basin. Often these seasonal forecasts fall short of talking about landfalls and tracks, particularly significant hurricanes, which tend to result in major losses for the insurance industry. In general, there is a correlation that a more active season will result in a higher chance of landfall. We now know that ENSO and SST are major climate forcers that aid in storm formation in the Atlantic Basin, but how do they relate to landfall? Recently at the Verisk Insurance Conference, Dr. Suz Tolwinski – Ward, a Principal Scientist and Senior Manager for Verisk, shared an excellent illustration of the landfall impacts of the climate forcers of Atlantic Basin SST and ENSO. This thoughtful chart below shows the distribution of major hurricane landfalls as a function of warmer-than-normal SST and the phase of ENSO. Major hurricane landfalls are much more common when ENSO is in a La Niña state, and SST in the Atlantic Basin is warmer (upper left quadrant). The expected quadrant for this upcoming hurricane season is warmer than average SST in the Atlantic Basin, but with ENSO being in an El Niño state (upper right quadrant). The chart illustrates fewer major hurricane landfall during these climate states. The tail of these two extreme climate states does not show any landfall in the far upper right of the chart, where we might end up this season with a really strong ENSO and a really warm Atlantic Basin SST.
Now, how does this translate into hurricane loss for the insurance industry? First, understanding that the Atlantic basin has been warmer than average since the mid-1990s. In years since 1995, there have been 10 La Niña events and 5 El Niño events. Over these years, La Niña years exhibit a higher landfall rate of 1.9 landfalls per La Niña event vs. 1.6 landfalls per El Niño event. However, the most positive news is when it comes to losses. The loss per ENSO event during El Niño is much lower at $7.3B vs. $12.5B in La Niña events. It should be noted that 2004 is the primary driver of El Niño losses since 1995, with 6 hurricane landfalls that season, 3 of which were major hurricanes and losses that would equal $35B dollars today. This one year really skews the loss of El Niño loss year to be much higher.
Nonetheless, history might not be the best predictor of the future, and we know that climate forcers are more complex than just a few different indexes. We could use a physics-based climate model to understand better the complexity that the Atlantic hurricane season might bring. This can no doubt help circumvent the limitations inherent in using a relatively short observational record to examine the types of return periods that interest the re/insurance industry.
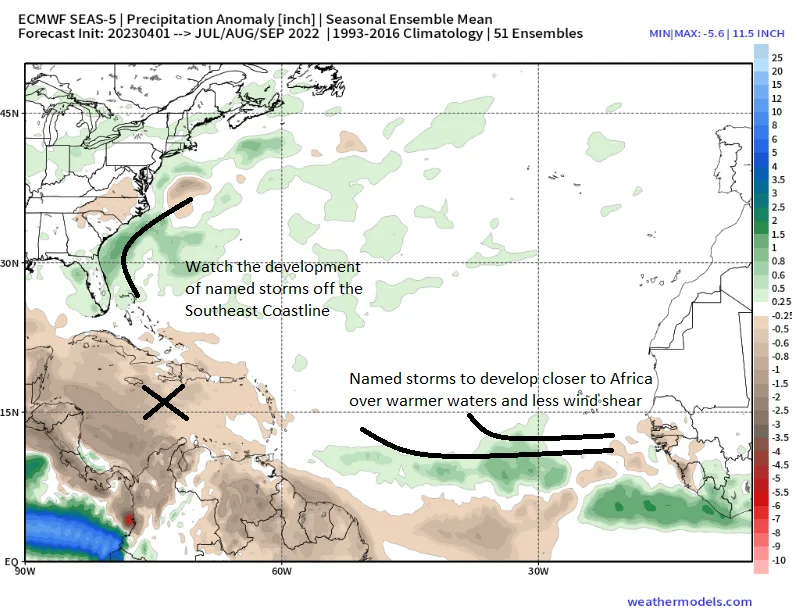
The latest ECMWF forecast model suggests a lot of precipitation anomalies off the coast of Africa and into the Main Development Region. No, this is not necessarily a forecast for named storm activity, but generally, precipitation in these regions would come in the form of tropical waves and could be named storms. The ECMWF shows very dry conditions in the Caribbean Sea, possibly due to increased wind shear from the developing El Niño, making it harder for convection to form, limiting the chances for rain in this region. There is another precipitation signal off the east coast of the U.S. and Florida and Bahamas, so this is something to watch as the region off the southeast coastline would not be as susceptible to wind shear. Therefore, it is possible that this is an area of name-storm development from decaying frontal systems as they move off the East Coast over the summer months. In the coming months, as indicated, the forecasts will tune into what is going to happen with ENSO and the Atlantic SST, and the physical models are clearly showing at this time some precipitation anomalies, which could mean storms develop early and recurve into the Atlantic with maybe some close to home development off the southeast coastline during the hurricane season. History would suggest a lower occurrence of landfalls and insurance loss at this time. This would be a nice reprieve from the last three La Niña years, which have also been active loss years for the insurance industry. Hopefully, Yo Soy El Niño will again help the insurance industry.


