Stay “Buckled Up” For Just a bit longer
About one month ago, our April 24th BMS Severe Weather told the insurance industry to “Buckle Up” as we sounded the alarm that a sequel was in the making for another very busy severe weather season. This BMS severe weather update offers up some good news as there appears to be a change in the North American weather pattern that would be less conducive to the formation of severe weather over parts of the Central Plains states by the middle of June. However, the impacts thus far have been far-reaching. At the time of our April 24th update, it was disclosed that insurance losses had already experienced over $10 billion of severe weather losses for the year. At this rate, the industry loss will be close to $20 billion by the end of May, given numerous high-profile severe events over the last few weeks. This includes two major severe thunderstorm wind events impacting the fourth and fifth largest metro areas in the U.S.; Dallas Fort Worth MetroPlex, Texas, on May 28th and the Houston derecho on May 16th. Keep in mind that power outages are a good proxy for storm impacts. And as of yesterday afternoon following the morning storms in Dallas Fort Worth MetroPlex, over 1.07 million electric customers were without power across Texas. This is on top of the over 1 million electric customers without power in greater Houston after severe storms moved across that area on the evening of May 16th.
The development of the most recent events offers a bit of a wildcard into how much loss can be expected for the insurance industry. Based on similar occurrences in the past, the last several events will cause several billion dollars in damages to the insurance industry.
Insurance loss estimates for severe weather have always been complex, with many moving components. After 2023’s record-breaking insurance industry loss year, insurance companies are starting to implement changes to limit some of the potential claims. Still, these changes, such as higher required deductibles and roof-only exclusions, could take a couple of years to work their way into understanding how they might impact reported losses as more risk falls on the insured and increase the overall protection gap of low severity severe weather events. We also know there have been several high-profile commercial losses due to this recent outbreak. Recently, reports suggest losses from the direct tornado that hit the 1 million square foot Dollar Tree distribution center in Marietta, Oklahoma on April 27th, to exceed $200 million. Commercial losses can be challenging to adjust, and with a higher inflationary environment, loss development can occur early as repair work is started, and unforeseen aspects of the repair can often surface. Outside of complex commercial losses are new risks, such as losses to the renewables industry; recently, the strongest tornado of the season so far impacted Greenfield, IA, with EF4 winds of 175 mph to 185 mph and tracking 43 miles also impacted about ten wind turbines across few separate wind farm installations on May 21st across Iowa. With an estimated cost between $4 million and $5 million per turbine, these unique risks will add up, but they will likely not get reported in industry total losses often published. Regardless, these are just some examples that make loss estimates difficult, which is why one of the talking points of the BMS Pathlight Analytics weather trends presentation is to highlight trends with weather data and not loss data, as losses are complex and difficult to estimate.
BMS estimates that by the end of May, losses are running below last year’s record-breaking year but are running about 128% above the 10-year average. On average, by the end of May, the insurance industry typically experiences 18 to 19 events. However, this year, the number of events has surpassed last year’s 23 events, with currently 27 industry loss events between January and the end of May.
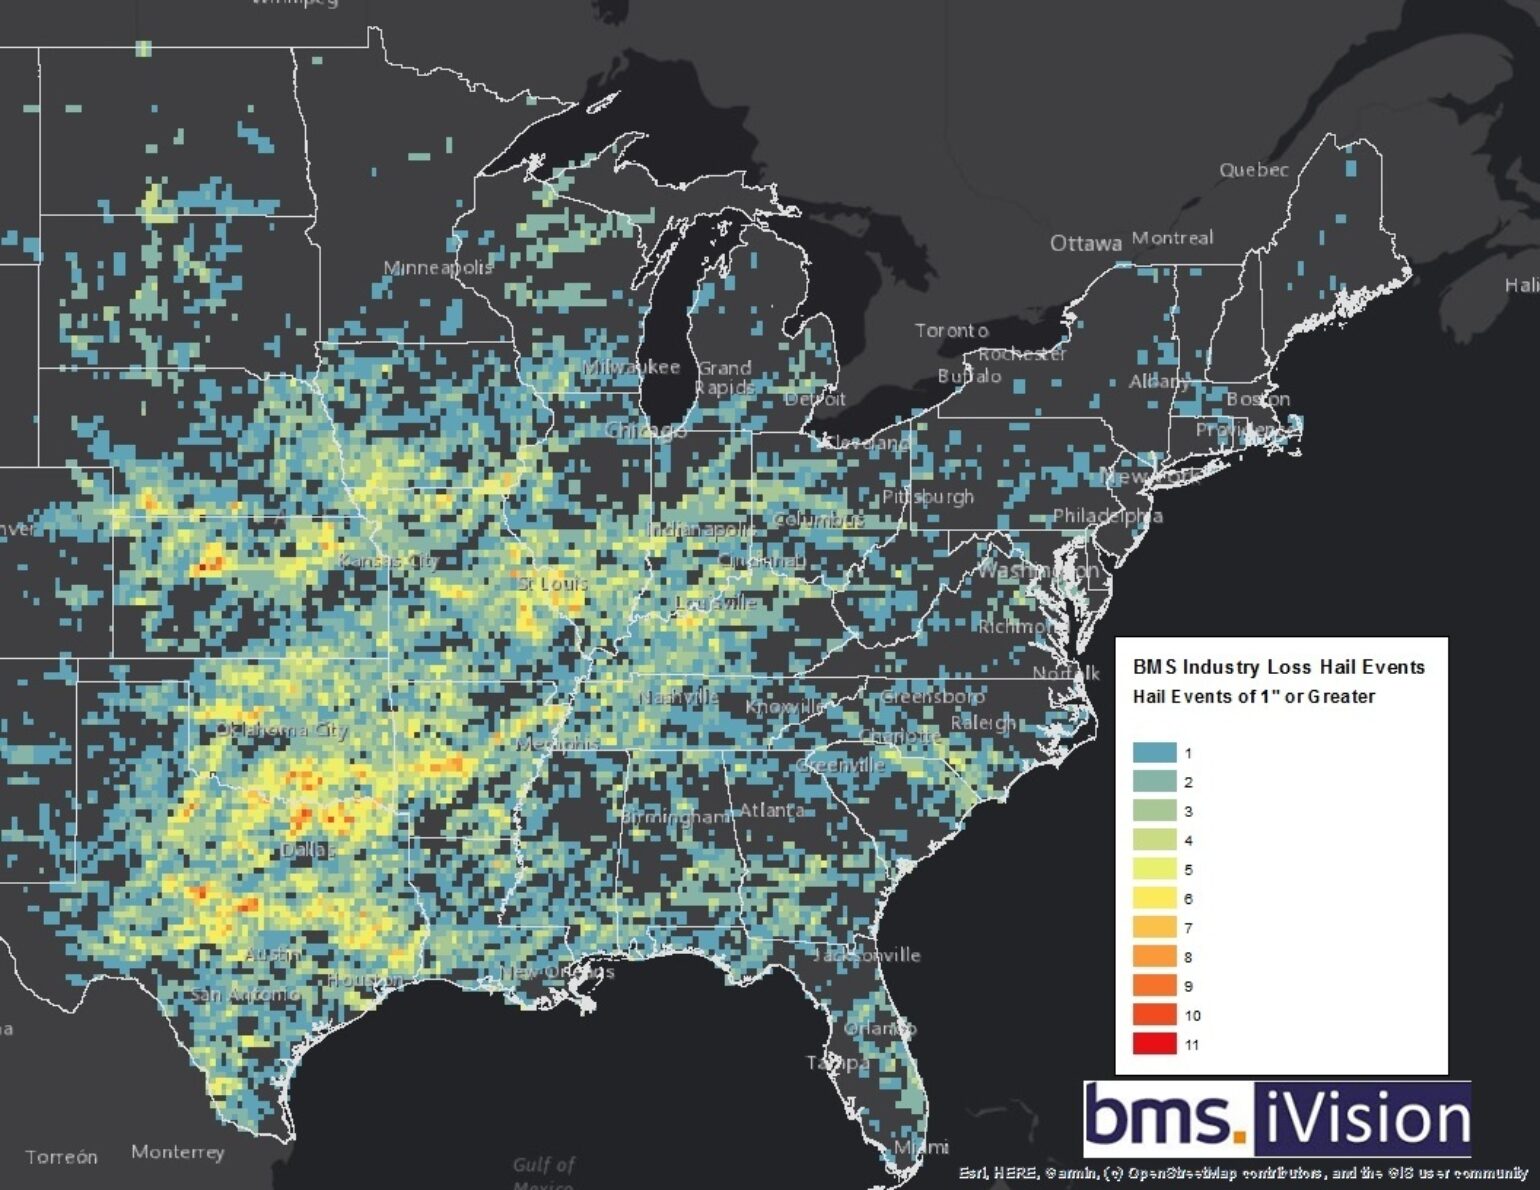
This constant severe weather shows up in the data as well. According to the SPC, since April 25th (past 34 days), the Continental United States has seen 26 days of at least enhanced severe weather (Level 3/5), according to the Storm Prediction Center. This includes 20 enhanced or greater days in May. This is the most enhanced severe weather day in May since the 5-category system was added in the fall of 2014. The previous record was 19 in 2022. So far, in 2024, over 1,919 tornado warnings have been issued, which is the most since 2011, and for a good reason; as of May 27th, 2024, it is already the most tornado counts since the very active for severe weather year of 2011 based on preliminary filtered reports shows which is likely sealing that 2024 will end up as at least a top five or higher tornado year for the U.S. While tornadoes catch a great deal of attention from storm chasers and the media. Still, general wind damage from thunderstorm winds or derechos can add to insurance industry losses. Local storm reports are running the third highest behind the wind reports a year to the day of the years 2017 and 2011, with about 5,899 high wind reports of damage, while the average since 2010 has been 4,160 reports a year to date. Of course, hail has the attention of the insurance industry, and the data suggests that this year is running about 352 reports above normal with 3,142 reported large hail events. Still, we also know that hail is likely being underreported in recent years, so these hail statistics should be used with caution. This is why at BMS, we use radar-provided hail swaths from Verisk Respond to provide a better idea of where hail is occurring and the overall frequency of that hail occurrence, which is shown in the image below.

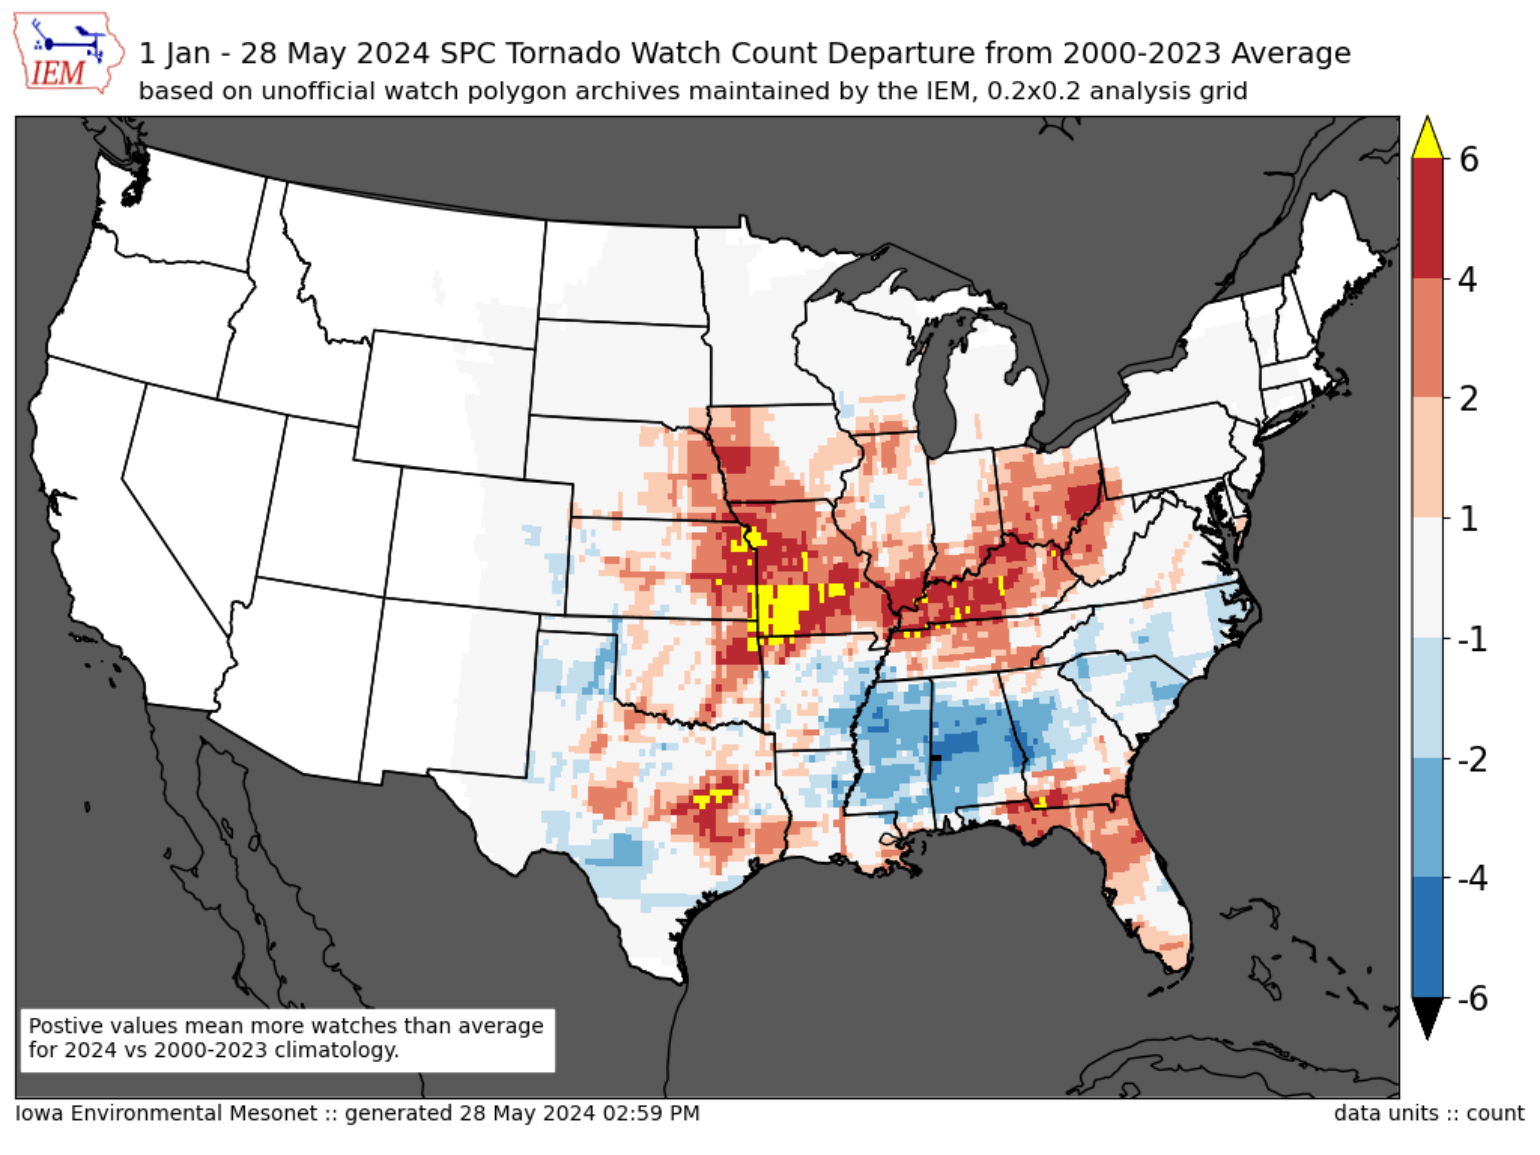
Another way to look at the frequency of severe weather is to use the National Weather Service tornado warnings above or below the average for each NWS office. Daryl Herzmann maintains a great set of tools at the Iowa State Iowa Environmental Mesonet automated data plotter. From what the insurance industry has been experiencing so far this year, it shows that it is greatly above average, and Dixie is way below average.

The Research and Data Will Help The Insurance Industry
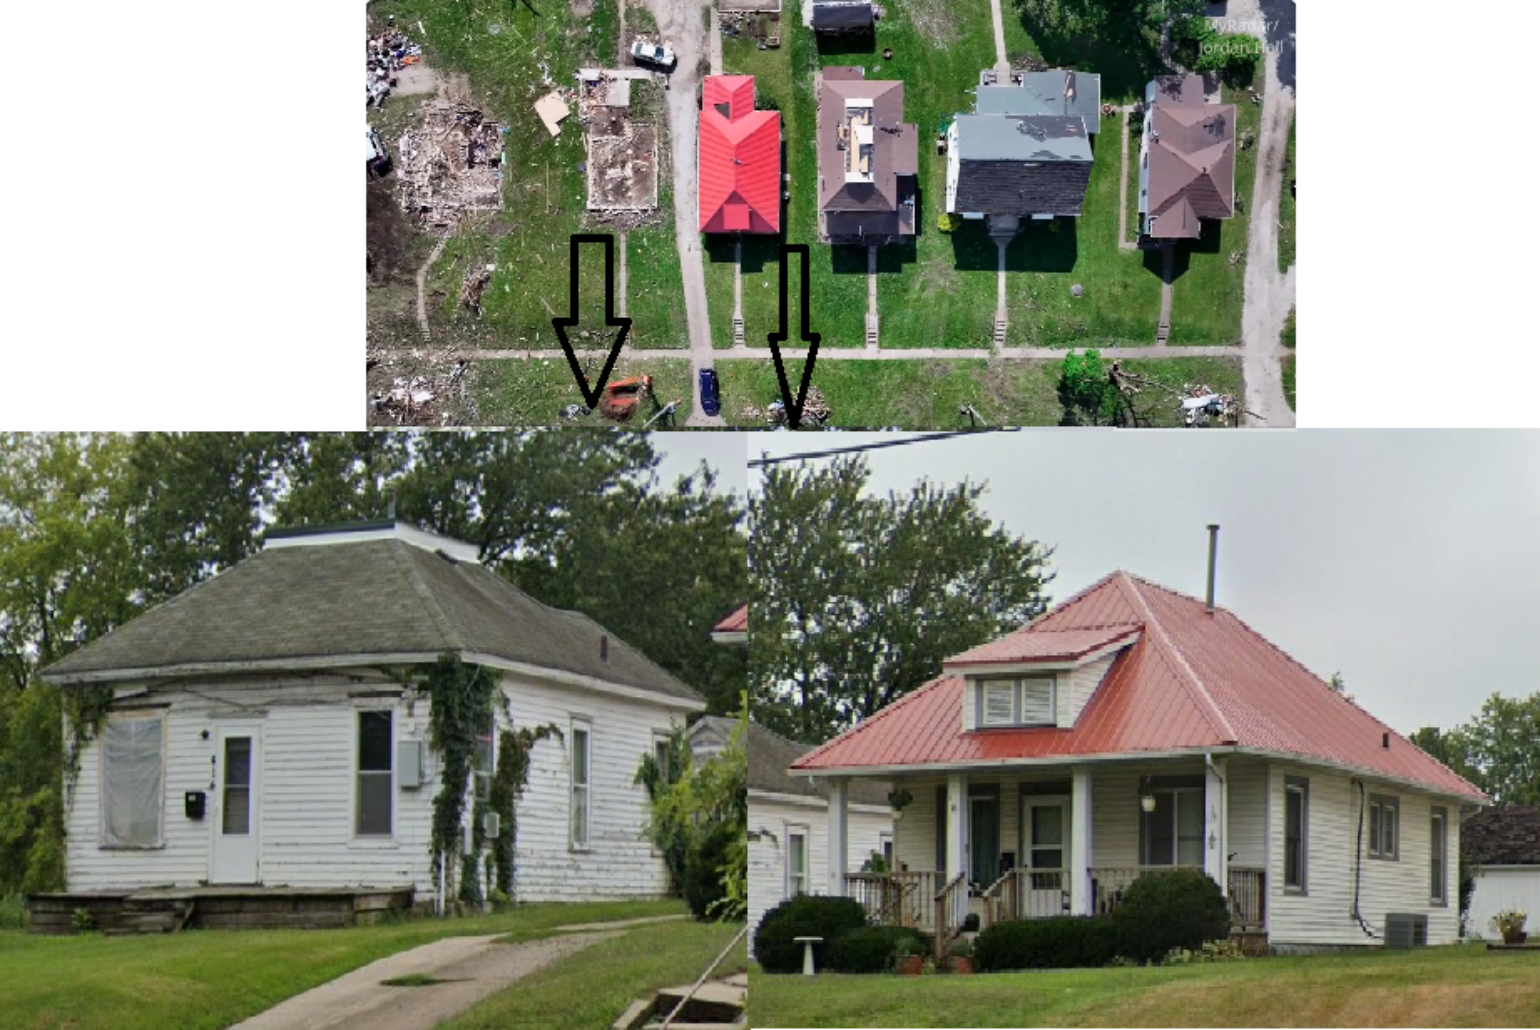
The maps above show that this year is shaping up to be painful for some insurance companies that are heavily focused across more traditional tornado alleys. However, this severe weather is offering great learning opportunities as well. First, with so many tornado impacts, the preliminary killer tornado count tracked by the National Weather Service is 36. Still, one has to wonder, without the forecast advances of the last several years, this count would be much higher. For example, the strongest U.S. tornado year to date that hit Greenfield, IA, had 46 min lead time from the first tornado warning (2:55 pm) to when the tornado struck (3:41 pm). There are horrifying images of damage from the same tornado and many others that have occurred, but these also offer lessons to the insurance industry. Below is an incredible illustration of how compact and intense the Greenfield, IA, tornado was. One house barely had damage, while the home next door was completely flattened. However, upon closer inspection via Google StreetView, there was a difference in build quality. The red-roofed house appears to be a new build, or at least certainly was in better shape than the one next door. Lessons like these can be quickly implemented into the underwriting of insurance properties.

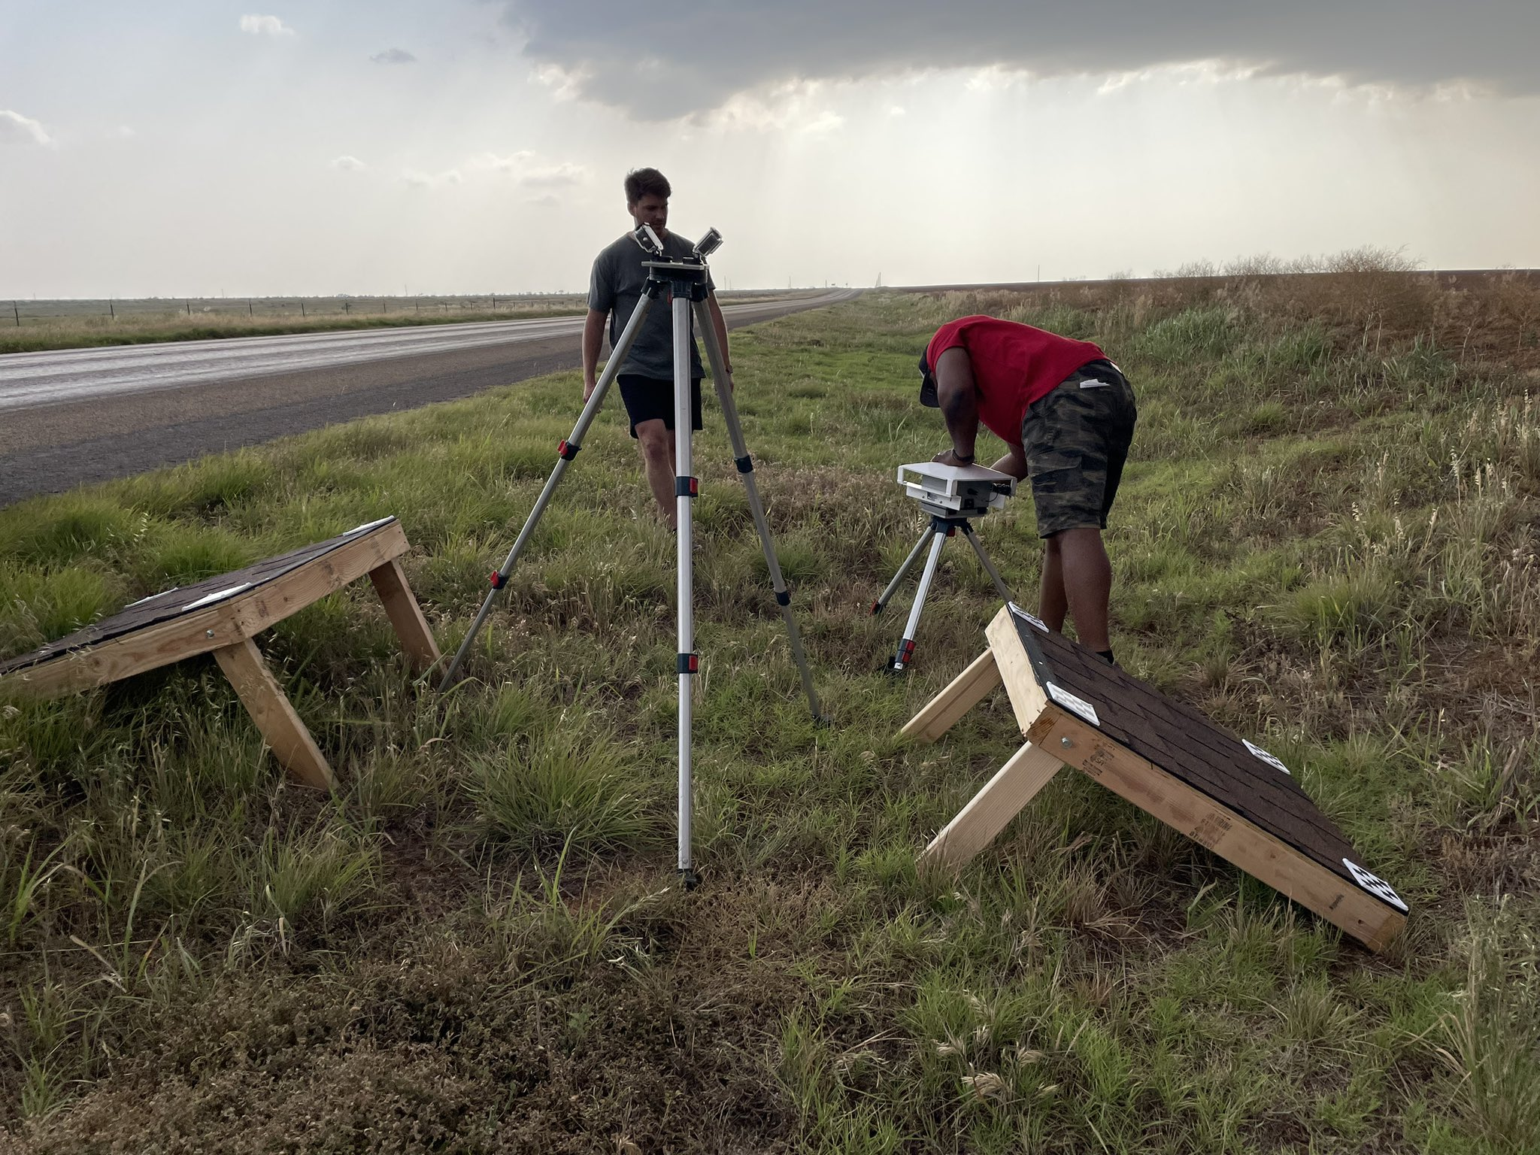
The lessons extend beyond wind damage from tornadoes and straight-line winds. Understanding hails is just as important considering that hail causes 50-80% of the overall severe storm losses to the insurance industry in any given year. We already talked a bit about hail and the possible underreporting occurring in the observational data. When we have major strings of severe weather, it creates great opportunities for the Insurance Institute for Business and Home Safety hail study program to get out in the field and take observations. This program has been ongoing since 2012, with the first mission to better understand hailstone properties, like density, size, and distribution. Now, the program is focused on hail storms, such as understanding the hail swath sizes and comparing them to radar, which will help answer how tight the gradients are of damaging hail. In doing so, they are actually deploying sensors and small roof sections to gather observations they can take back to the lab to further help in the simulation and recalibration lab testing for different building materials to help the insurance industry limit future losses. BMS is a proud sponsor of the IBHS.

Short Term Severe Weather Forecast
The first week of June is certainly starting to light up for potential severe weather on medium-range guidance. Once again, insurance carriers with exposure are mostly for the southern plains, but even the central plains will continue to feel the impacts of continued severe weather in the short term. These areas need a break, but it appears some east coast troughing and continued subtle shortwaves coming over the Rockies should push more severe weather further west into the front range and into west Texas. In fact, a prolonged period of moisture influx from the Gulf may result in multiple days of large convective available potential energy days, which is a large indicator of more severe weather days ahead.
Longer Term Severe Weather Forecast
By the middle of June, there may be a weather pattern shift for North America, which has less of an active jet stream. The focus of thunderstorm development will be regional and driven by more mesoscale daily patterns and less by synoptically driven patterns. This overall pattern will switch from a trough over the western US to ridging, which is less favorable for tornadoes across the Great Plains. However, this new pattern will bring new concerns to the insurance industry as the abundant amount of fine fuels (grasses) start to dry out west and increase the wildfire risk as increasingly warmer, drier conditions take hold.
