By- Andrew Siffert - Vice President / Senior Meteorologist
The global tropics have finally taken a breather since the powerful Iota dissipated over Central America on November 18th. However, the recovery has just begun or continues for many. Folks in the Philippines, Vietnam, Honduras, Nicaragua, Guatemala, and, yes, the United States have a long road ahead to recover from devastating named storm landfalls this year. Below we have included our top 5 headlines concerning the 2020 Atlantic Hurricane season.
1.) Active Atlantic Activity, but NOT Northern Hemisphere.
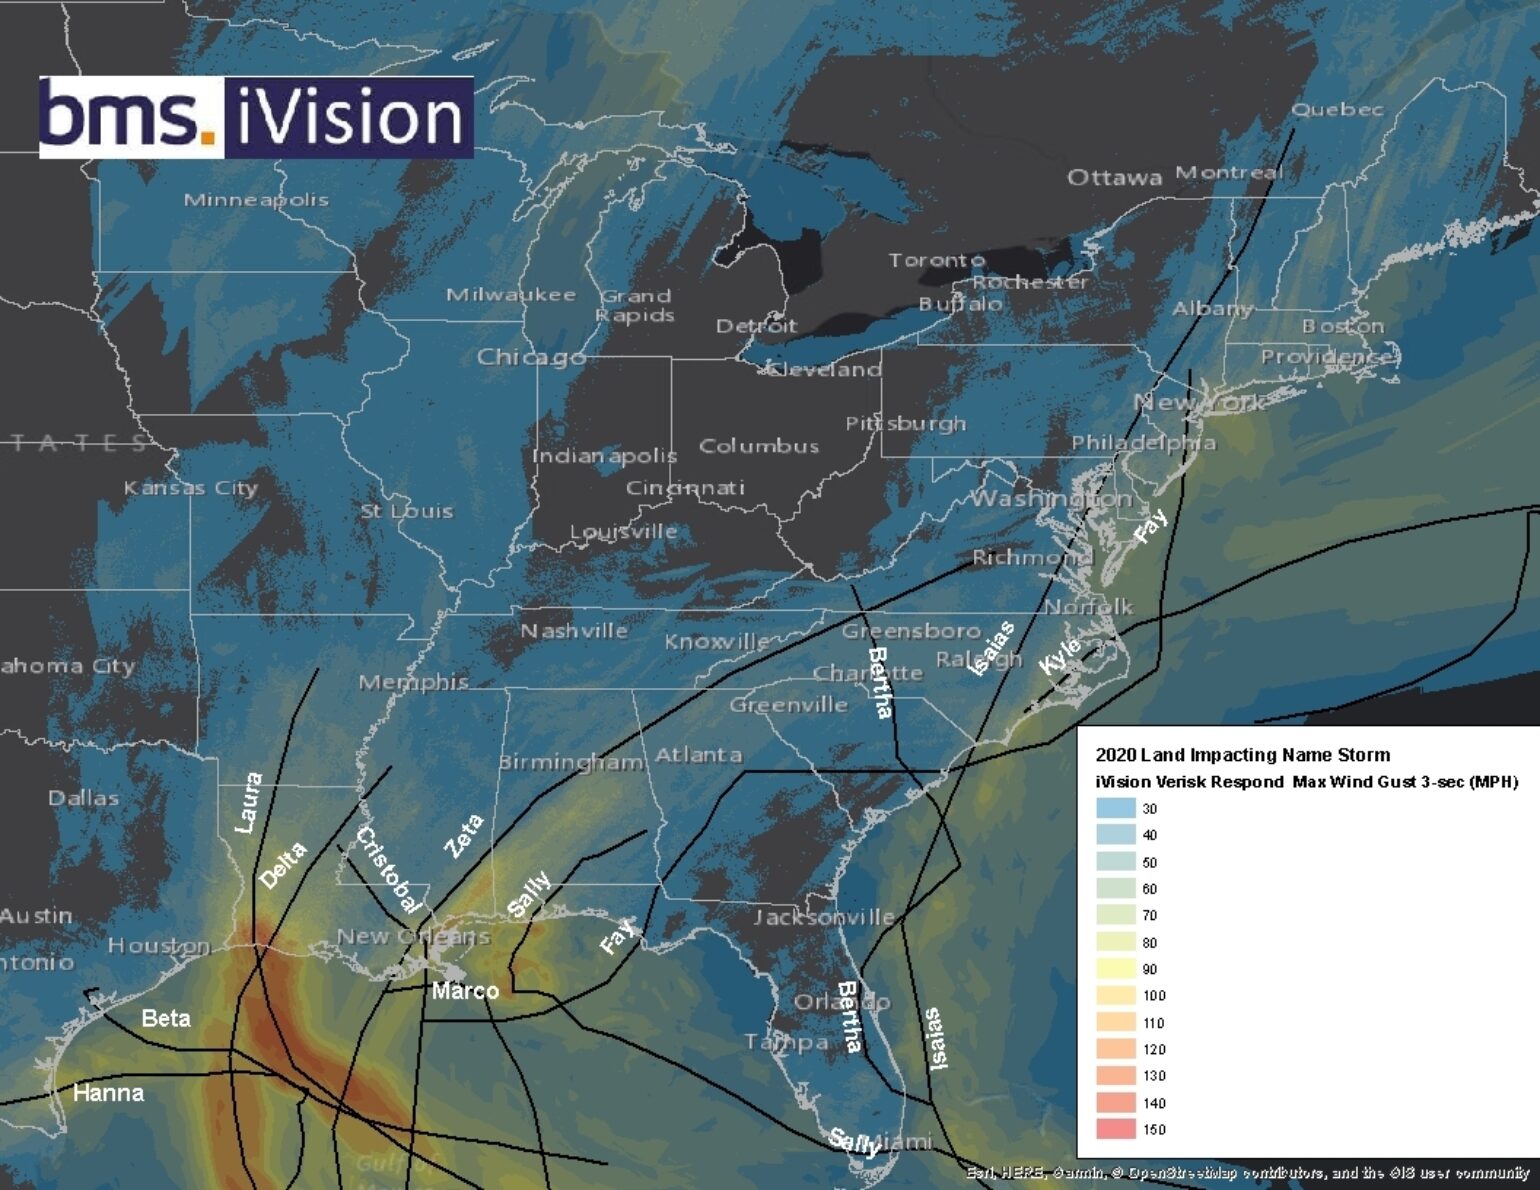
It has been a record-breaking year. The Atlantic has had 30 named storms in 2020, which is the most ever since 1966 at the start of the satellite era. In terms of U.S. landfalls, there have been 12 named storms and 6 hurricanes. Pretty much every section of the U.S. coastline has seen some type of named storm wind gusts over 30 mph. Below is likely the most comprehensive summary of the 2020 Atlantic Hurricane Season in terms of wind impacts. This is a summary product from BMS IVision Verisk Respond 3 second Wind gust product. The Gulf Coast and Louisiana took the brunt of most of the activity this year with several strong wind events.

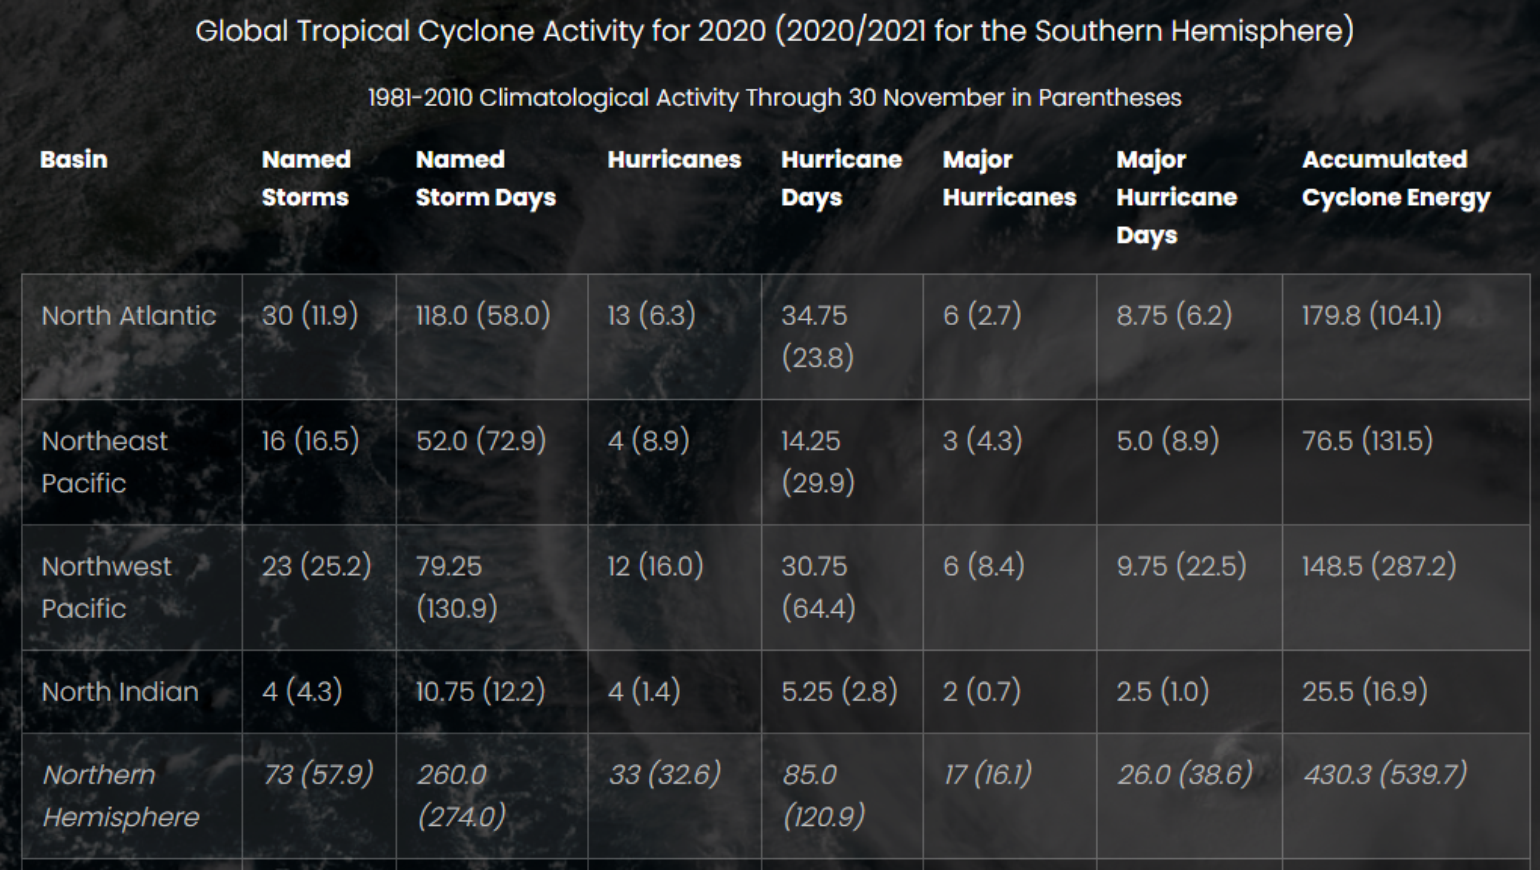
There are plenty of other write-ups about how active the season has been in terms of statistics on major media outlets, so no need to dive into these details. However, what might not be widely mentioned is just how normal to below normal the other Northern Hemisphere basin activity has been this year so far. Below is a summary table as of November 30th of Northern Hemisphere basin activity as compiled by Colorado State University. The table shows just how active the North Atlantic Basin has been compared to the other more normal to below normal basin activity in the Northeast Pacific or Northwest Pacific. Overall the world as a whole is in balance in terms of named storm activity and it is this world view that also matters to the reinsurance industry.

2.) Active Landfall With Lots of Rapidly Intensifying Storms
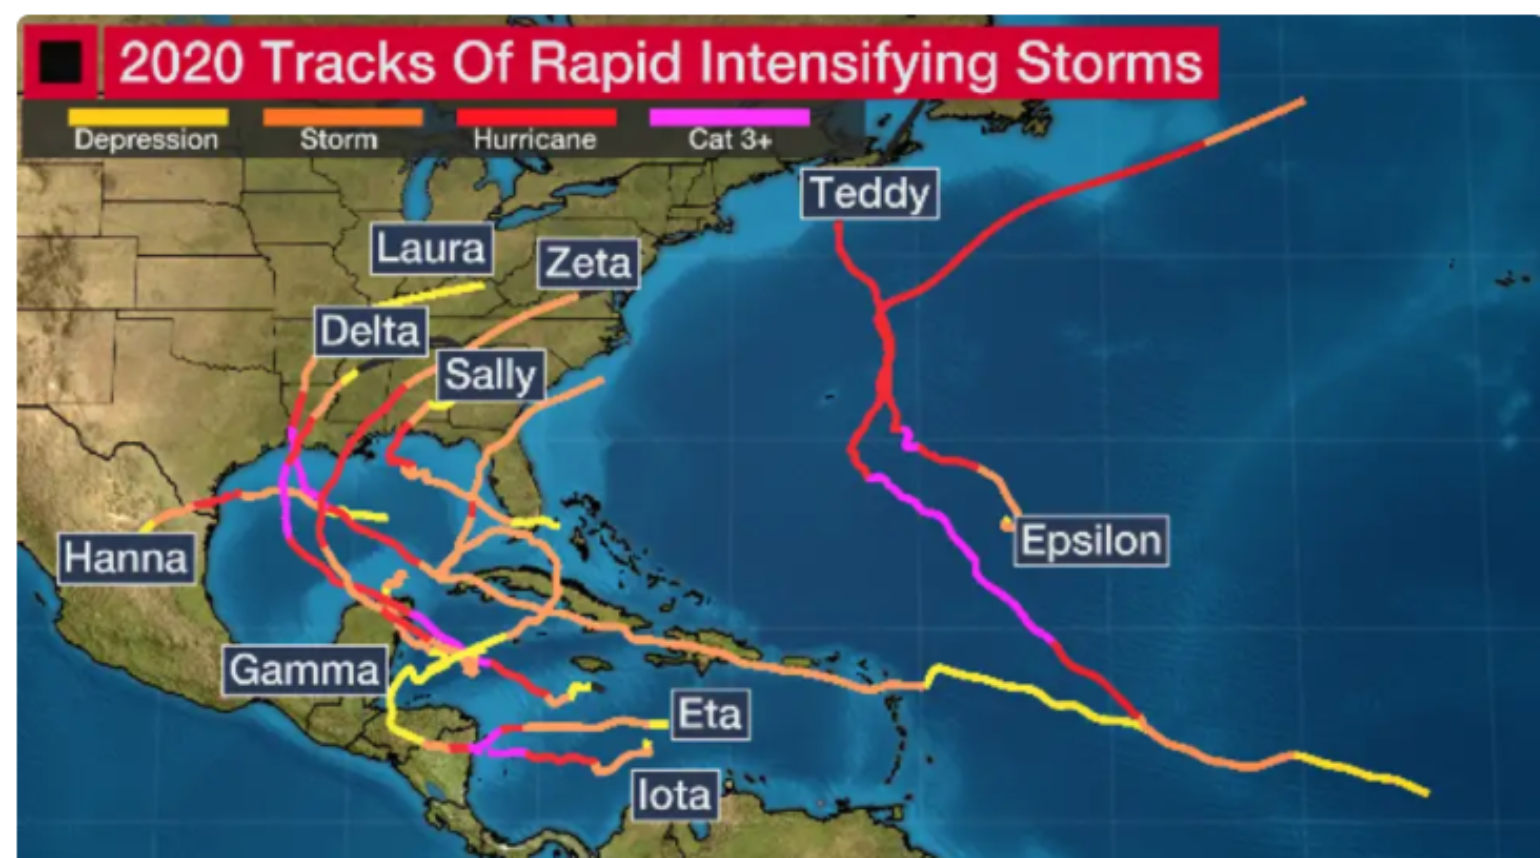
Rapid intensifying storms in particularly before landfall have major impacts on the insurance industry. One aspect of this hurricane season that matters a lot to the insurance industry is that it tied the 1995 season with 10 named tropical storms that experienced rapid intensification. However, unlike 1995, a lot of these storms were near landfall. Rapid intensification is defined as an increase in winds of 35 mph in 24 hours. Once the peak of the season started in August through October, and especially this autumn, some of the best conditions for tropical storm development in the world occurred in the Atlantic. What is maybe most unusual is that six of the last seven storms of the year rapidly intensified and all of which were Greek alphabet systems occurring so late in the season. This is very important because research is suggesting there is an observed increase in the number of storms that have rapid intensification. Additionally, climate model simulations also suggest that the future might have a higher percentage of overall storms that form will rapidly intensify.

Now what might be the most concerning of this trend in 2020 is that of the 10 systems that rapidly intensified four systems rapidly deepened, meaning the pressure dropped more than 40 millibars in 24 hours. And again the two fastest pressure drops came at the tail-end of the season in November when activity usually wanes — Hurricane Eta followed by Hurricane Iota had devastating impacts on Central America and made landfall just 12 miles apart, which brings me to my third unique point that matters to the insurance industry.
3.) Clustering of Landfalls
2020 had a handful of clustering landfalls. Not only did Hurricane Eta followed by Hurricane Iota make landfall 12 miles apart from each other on the remote coastline of Nicaragua, but Hurricane Laura and Delta made landfall approximately 15 miles apart on the remote coastline of Louisiana. The clustering was not just in the Atlantic Basin, but in the West Pacific Typhoon Maysak and Typhoon Haishen made landfall 25 miles from each other near Busan and Ulsan, South Korea as category 3 and category 2 hurricanes within five days! Named storm clustering is not that unusual during a given hurricane season. When clustering happens it is because there are common drivers in atmospheric persistence such as the steering currents of weather systems over a few weeks which make clustering more common. Over the years there has been a lot of discussion of the application of clustering in the insurance industry since the 2004 and 2005 active hurricane season. Most catastrophic hurricane risk models implement clustering and allow it to flow through to the financial model. However, this year we again saw that clustering of storms creates a lot of challenges in catastrophic response. Events are treated independently in the models and do not explicitly account for the clustering impact on demand surge, which creates uncertainty around the impact of an event. 2020 is yet another year to better understand the clustering impacts as further research is also needed to understand how best to apply such events in the context of catastrophic losses at the time of the event and for future losses.
4.) Losses Will Continue to Develop, But This Season Could Have Been Much Worse
So far estimated insured losses for the U.S. named storm activity is over $16B. This is accounting for 27% of the total losses to the U.S. insurance industry so far this year. However, these named storm losses will develop. In fact, between Hurricane Laura's first estimate and second estimate, the development has been 47% according to the Property Claims Services. If one assumes that that same type of development is likely to occur over the other major hurricane losses this year, the expected industry loss from named storm activity jumps to an estimated $20B for the year. The extreme end of the summed catastrophe models loss scenarios for the year is set at $31B so clearly, there will be some development from the current $16B loss estimate. Despite the apparent size of the current loss estimate and the expected development, the aggregated losses is quite close to the U.S. industry average annual loss for U.S. named storms that should be expected in any given year. In fact, even with the unlucky nature of multiple Gulf Coast impacts, the losses this season could have been much worse. During Hurricane Laura’s landfall, it was discussed how devastating such a storm might have been to Houston had it made landfall just 100 miles west along with maybe another clustering event of Delta to the same general area. This clearly would have been an event that would have reached the tens of billions of dollars of insured loss. Although New Orleans was impacted by Hurricane Zeta in late October, if Zeta's track had been 10 or 20 more miles west the outcome would have been much different for the city in terms of loss, as the strongest winds still seemed to miss much of the city to the East. Although Florida had some minor named storm impacts this year, clearly it was on the lucky side of the losses this season, considering Florida has the highest likelihood of named storm loss during a given hurricane season and to have limited impacts during the most active season on record is quite remarkable.
5.) Season Forecast Was Correct, But Still Off
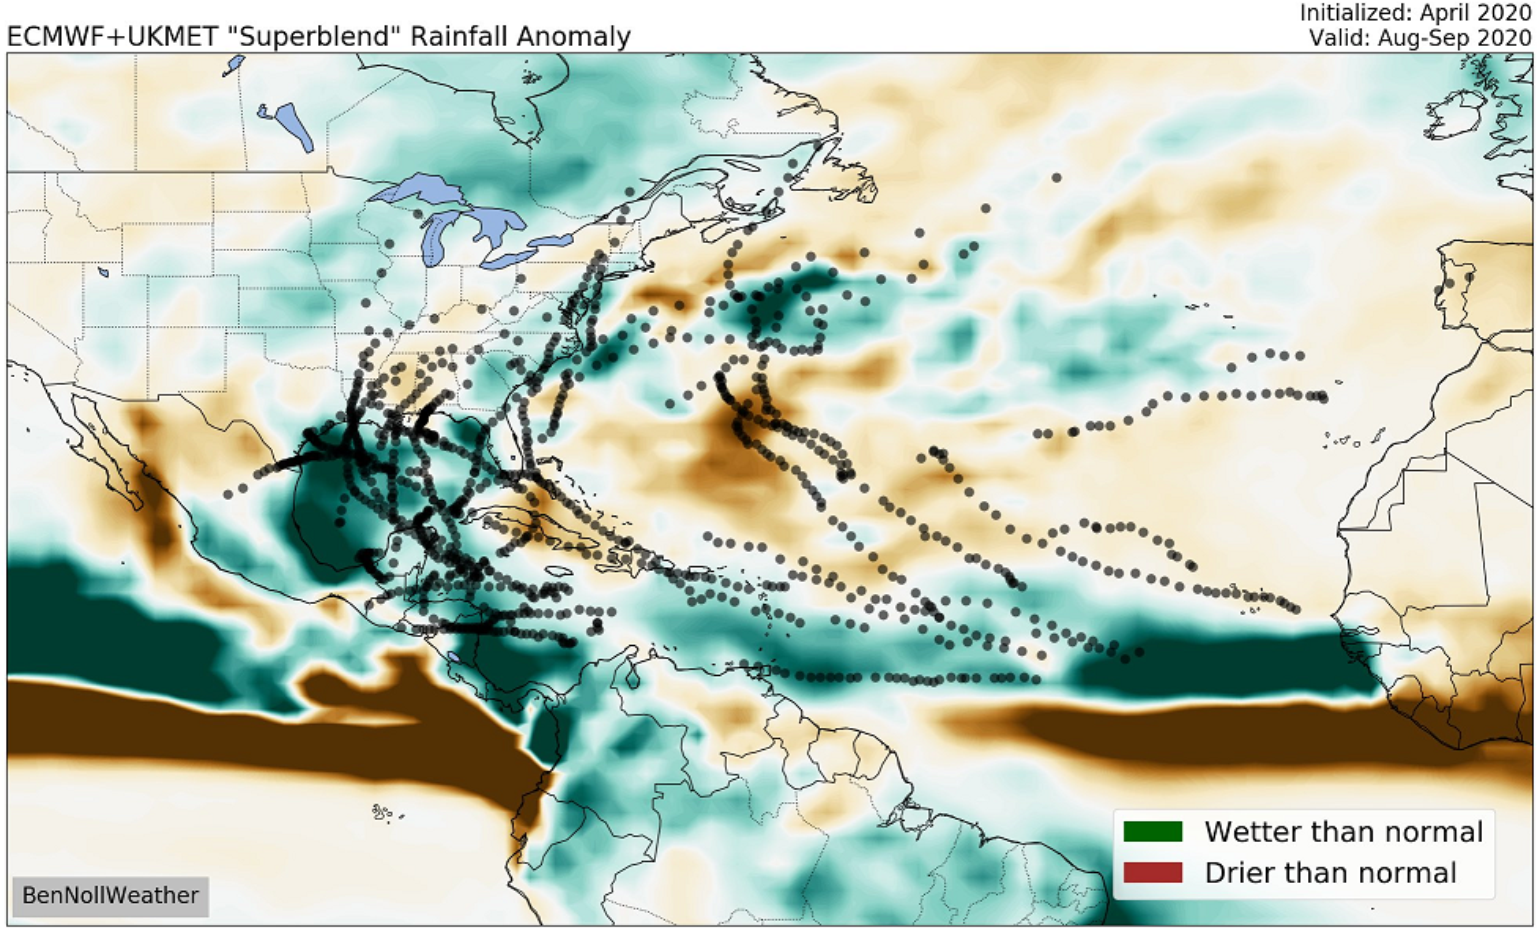
2005 was a bellwether year, then 2017, and now 2020. One season or event does not prove anything specifically, but this is another hurricane season with more rapidly intensifying storms and a higher percentage of storms becoming cat 4/5 in the Atlantic Basin. This is not possible to forecast before the season. Back on May 4th when I posted my Blog Trouble is Brewing, the forecasts were yelling that this year would be an active year, but a hall a fame year was not expected. In the early season, I tried to show tracks and the activity by looking at analog years and some seasonal forecast models. The good news back in the early season was that the seasonal forecast models showed what might be a glimmer of hope for the insurance industry. Back in May and June Richard Dixon plotted the ECMWF seasonal wind forecast. He showed that forecasts showed that elevated wind activity of winds > 50 mph was expected along the Gulf States compared to climatology. This same signal also showed up in April the seasonal rainfall anomaly forecasts, which showed wetter than normal conditions in the general areas that saw most of the storm activity this year. So if we can continue to see this type of improvement this could surely change how capital is utilized in the insurance space. This is also maybe the start of a new era where the insurance industry can start to move away from just the quantitative guidance of tropical cyclones counts and really trying to utilize the dynamical forecast models to provide more insight on what to expect going into an Atlantic hurricane season.

