It’s been a while since the last BMS Tropical Update on July 11. That update focused on Tropical Storm Barry, which eventually made landfall along the central Louisiana coastline as a minimal Category 1 hurricane. Even though it was a disheveled mess of a storm, it still caused nearly $100 million of insurance industry loss in Louisiana and set an Arkansas state rainfall record of 14.58” near Murfreesboro, Arkansas. Luckily, this large amount of rain did not fall along the Mississippi River in southern Louisiana, which was at already historic high levels along many sections, including levy-protected New Orleans. With Barry’s landfall, it joined 12 other July hurricane landfalls in the Gulf of Mexico since 1900. However, as we look forward to the remaining months of the hurricane season, it’s worth noting that there is no correlation between hurricane activity occurring before August and how much activity will be seen during the remainder of the season.
By now you may have seen the various updated Atlantic hurricane season forecasts, which, for the most part, continue to call for above-normal activity. As I have stated several times, the overall number is not what is important, but, rather, the steering currents that influence the track(s). Contrary to popular belief, however, most named storms have fairly regular and well-defined tracks because of the location and orientation of the Bermuda Azores high pressure, which ultimately determines the tracks of most named storms. The difficulty in predicting a storm track occurs either when the typical climatological steering wind flow is replaced by a less common, large-scale flow or, even more importantly, when rapid changes occur in the strength and orientation of the steering current, such as a bypassing mid-latitude trough, which is really only well-forecasted 5 to 7 days in advance.
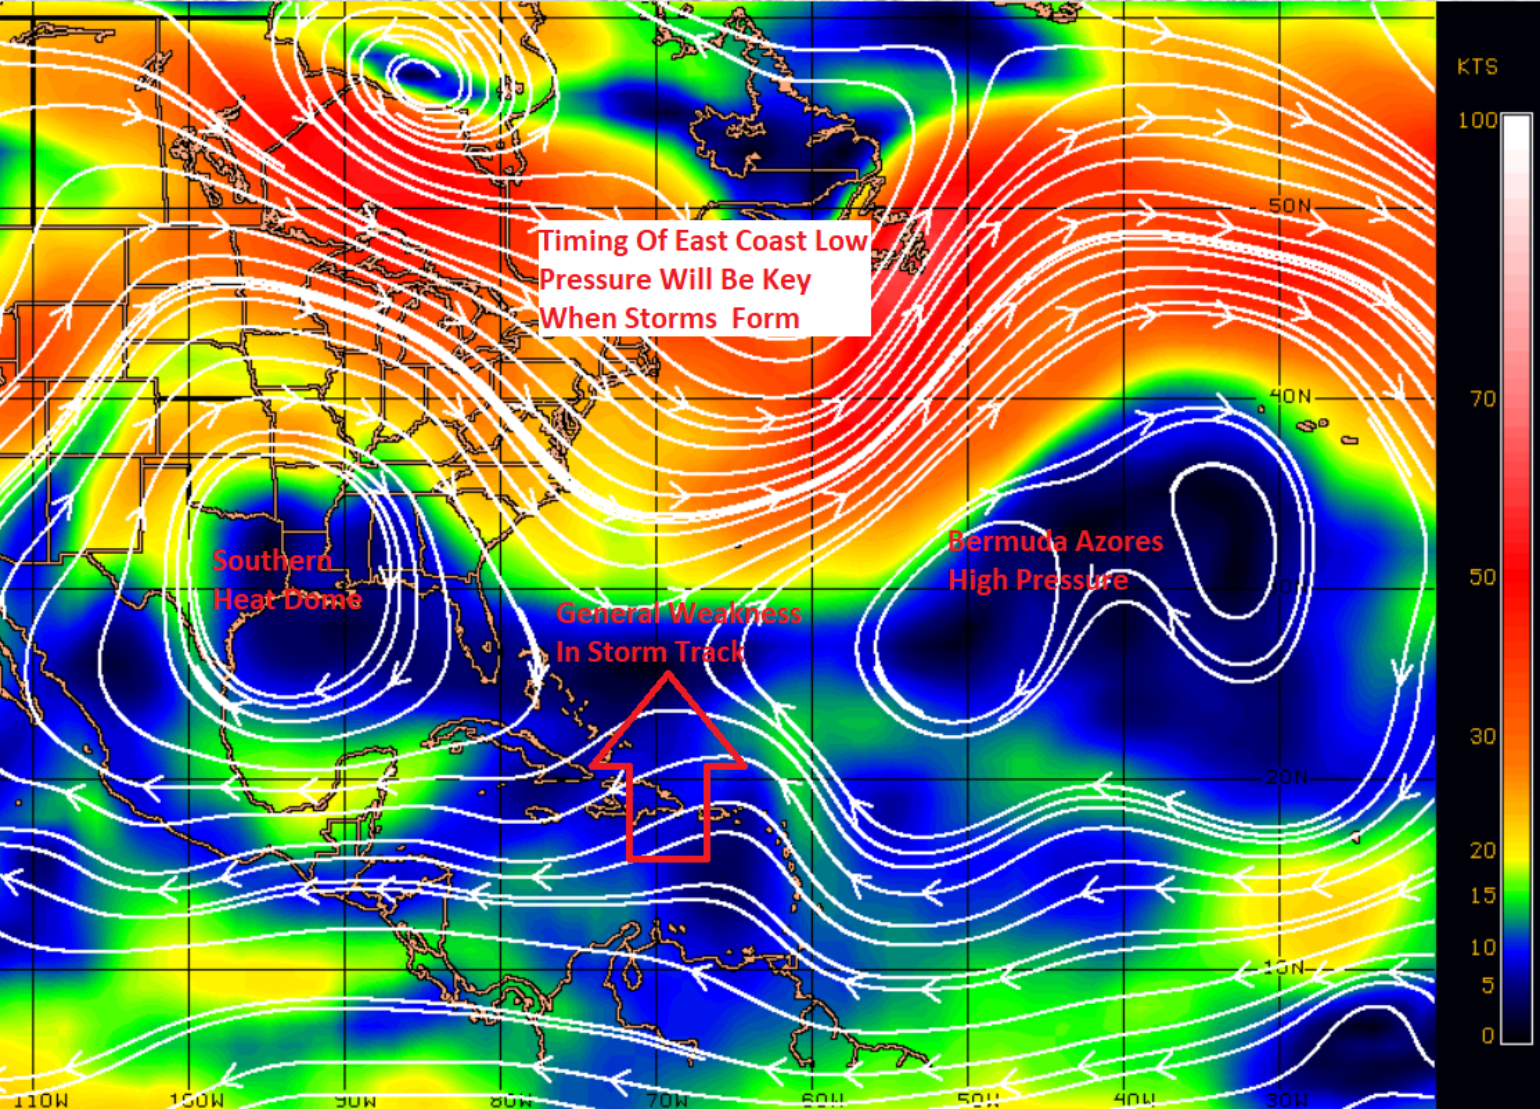
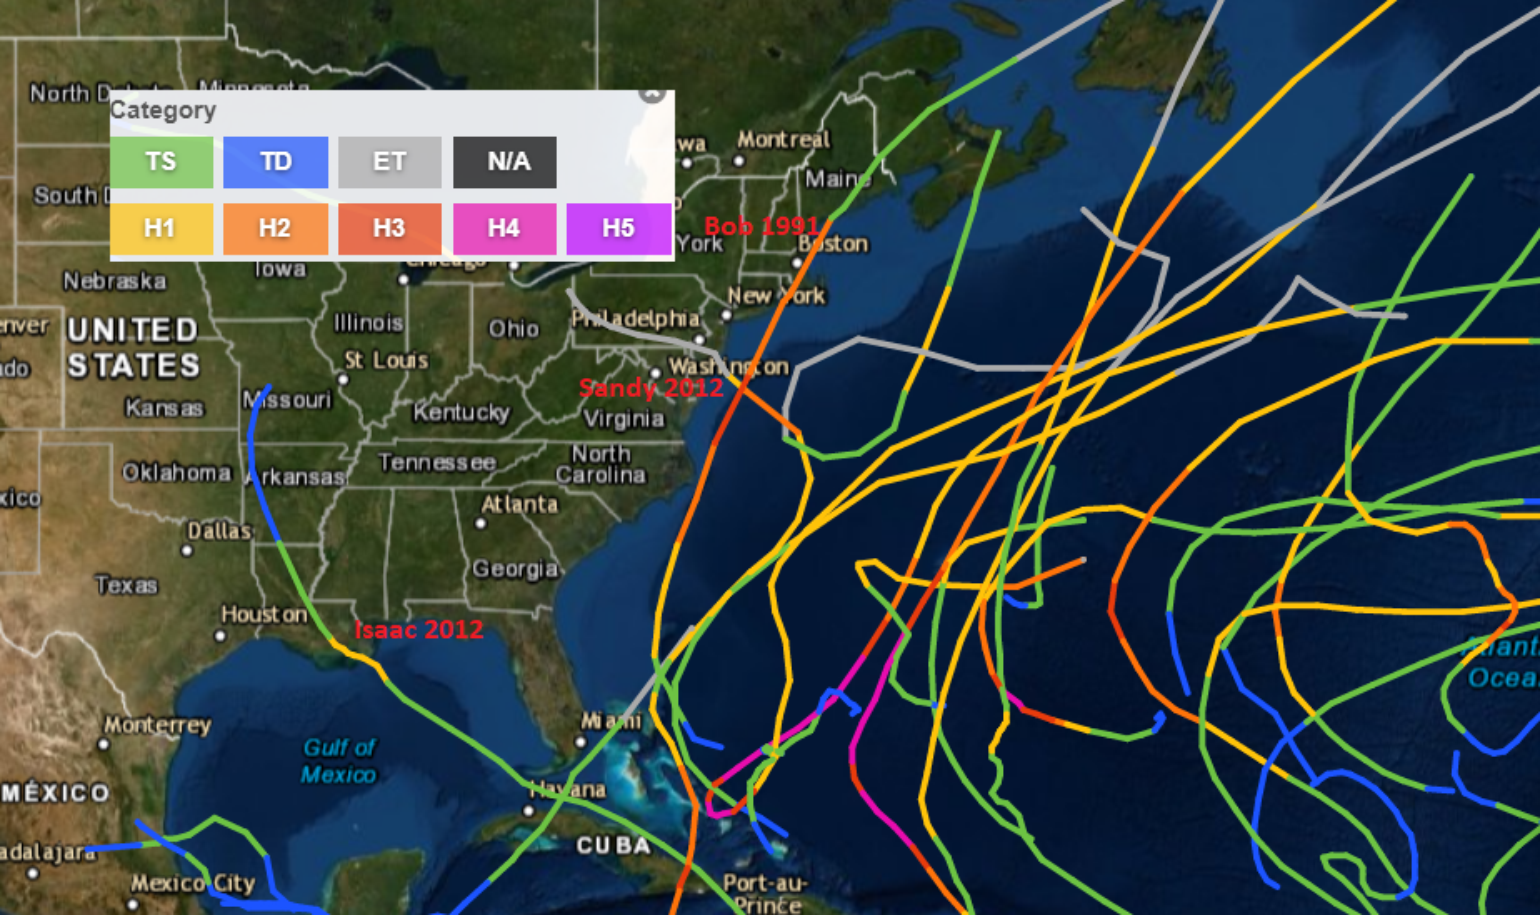
The average date for the formation of the season’s third named storm is August 13, and the average date for the second hurricane is August 28, so there is nothing unusual about having a calm spell this time of year like we’ve seen recently. There have been several tropical waves that have propagated from the African coastline, and a few of these have been watched by the National Hurricane Center. Tropical Depression Three, which formed for less than 24 hours off of the eastern coast of Florida, provided a glimpse of where named storms could track this season if the current North American and Atlantic pressure patterns hold into the peak of the hurricane season. However, first let’s determine the factors to consider for the remainder of the hurricane season and then worry about the steering current once the storms begin to form. In the beginning of the season, it was suggested that named storms would form closer to the U.S. coastline rather than in the Main Development Region, and track closer to the eastern coast of the U.S. with the overall season seeing more back half activity.
Although many of the headlines suggest that an above-normal season is yet to come, these headlines should probably be taken with a grain of salt. Take the NOAA forecast, for example. There is a 45% probability of an above-normal season, which obviously means there is a greater chance of a normal to below-normal season at 55%. In fact, I don’t think there is much confidence in the August activity forecasts, even though they are usually the most accurate when it comes to the overall Atlantic Basin activity.
There are a number of reasons why there is a lack of confidence in the forecast:
- Lingering effects from El Niño, which is now in a neutral state. A neutral state El Niño should enable more activity across the basin, but sometimes the atmosphere has to play catch up to what is occurring with ocean temperatures half a world away which could still limit development this season.
- The Sea Surface Temperature (SST) pattern in the Main Development Region has been a little cooler than normal so far this season. However, SSTs are mostly above normal in the sub-tropics. While this isn’t typically associated with active seasons, it also means that tropical waves are more likely to further develop when they move out of the tropics and into the sub-tropics.
- It remains to be seen if the dry dusty air from the Saharan Air Layer (SAL) will weaken as typical climatology would suggest. But, there is no doubt that the presence of SAL has been one of the factors in limiting tropical convection so far this season.
- Another enabling factor has been the large-scale subsidence which has been over the Atlantic basin. Although the normal active MJO pulse has helped with bits of convection, the overall larger scale subsidence has been preventing large scale convection. The next MJO pulse could begin to influence the Atlantic Basin at the end of this month and then again in the middle of September.
Unfortunately, even with the more reliable August forecast, there are still a lot of variables for the remainder of the season. Perhaps the best guidance would be to view the analog years, which serve as a guide for potential activity and possible tracks for the remainder of the season.
This week we may see the remnants of an old stalled front off of the eastern coast of the U.S., providing a chance at tropical cyclogenesis closer to home. Hopefully, there won’t be a need for too many BMS Tropical Updates over the next 30 days, will be keeping an eye on how any potential events could impact the insurance industry.