

Did you know there are at least 25 different seasonal forecasts for the 2021 Atlantic hurricane season? Most of these forecasts suggested that the Atlantic hurricane season will be above normal in terms of named storm counts.

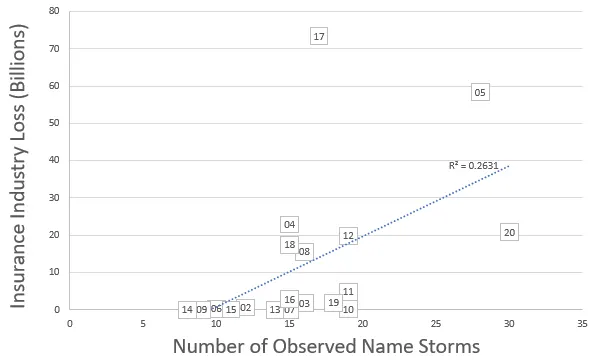
With this much named-storm activity forecasted, should the insurance industry be concerned? One might expect hurricane activity to be correlated to insurance losses; however, recently there has not been a strong correlation. Last year is a perfect example. There was a record number of named storms (30) with 13 named storms affecting the U.S. and 6 of them directly impacting Louisiana, yet the total industry insured loss of $21 Billion was fairly low for this many named storms. In contrast, years like 2017 had high levels of loss ($73 Billion) even though there were just 17 named storms that season. Additionally, 2019 had very little loss ($2B), but yet 18 named storms in the basin. Overall, since 2001, the correlation between named storms and insurance industry loss is 0.51. The R squared is a low 0.26, so there is not much value in just assuming an active season will lead to more insured losses.
Early Season Activity
So far this season the Atlantic Basin has already experienced four named storms. However, these storms have been short-lived and relatively weak as measured by Accumulated Cyclone Energy, which year to date is at 37 when normally the year-to-date climatology would suggest a value of 64. Therefore, the season is running about 58% of normal. However, only three other years since 1850 have had a faster start to the 4th named storm. Those years were 2012, 2016, 2020 and might point to what to expect in 2021 and the insured loss. In 2012, which had 19 named storms, three landfalling storms occurred. This included Sandy and its subsequent large insured loss ($21B). 2016 had 15 named storms and two landfalling storms, one of which was Matthew that just missed South Florida. And of course, 2020 was a record-setting year with most storms luckily missing major populated areas resulting in a relatively low level of loss for so many impacts, but still impactful. Based on this, the dice could be loaded again this year for impacts to the insurance industry, which have already occurred in minor form from Claudette and Danny over the last two weeks.
Forecasted Tracks Help Understand Future Impacts
Beyond the abundant forecast support in terms of named storm activity, the dynamic seasonal forecast model guidance for rainfall anomaly for the August, September, and October time frame can provide clues on tropical convection since this would likely be the cause of positive rainfall anomalies. The latest guidance favors abundant easterly wave activity coming off the coast of West Africa with wetter than normal conditions expected in many of the same areas the analog above suggests; such as the Southeast coastline of the U.S. including Florida, Cuba and Hispaniola, Central Atlantic East of Bermuda, and Central America.

Named storms can track in any direction depending on steering currents of the upper-level atmosphere pattern in play at the time of storm formation This is not predictable until 10 -14 days in advance, but, as we have seen with the 2020 and other year’s storm tracks, they generally tend to cluster around these steering currents throughout a season. So far if you have been watching the National Hurricane Center (NHC) there have been lots of hints as to storm tracks this season. In fact, according to the NHC 5 day outlook, this is the 81th 5-day outlook with at least one area of interest. What is a bit unusual is all the activity that is coming off the West Coast of Africa so early in the season.
When you combine this with the propagation of the early season tropical wave activity off the West Coast of Africa, as predicted by the dynamic seasonal forecast shown above, you get the hints that the storm tracks will end up in the areas of higher positive rainfall anomalies. This points to Florida and parts of the East Coast as the greatest threat for landfalling activity this season and leads to exactly what might happen to Tropical Storm Elsa that NHC is currently watching over the central main development region of the Atlantic Ocean. Elsa is the earliest-known fifth named storm on record for the Atlantic basin in the satellite era which breaks the record held by Edouard on July 6th last year.
Current Troubles (Elsa)
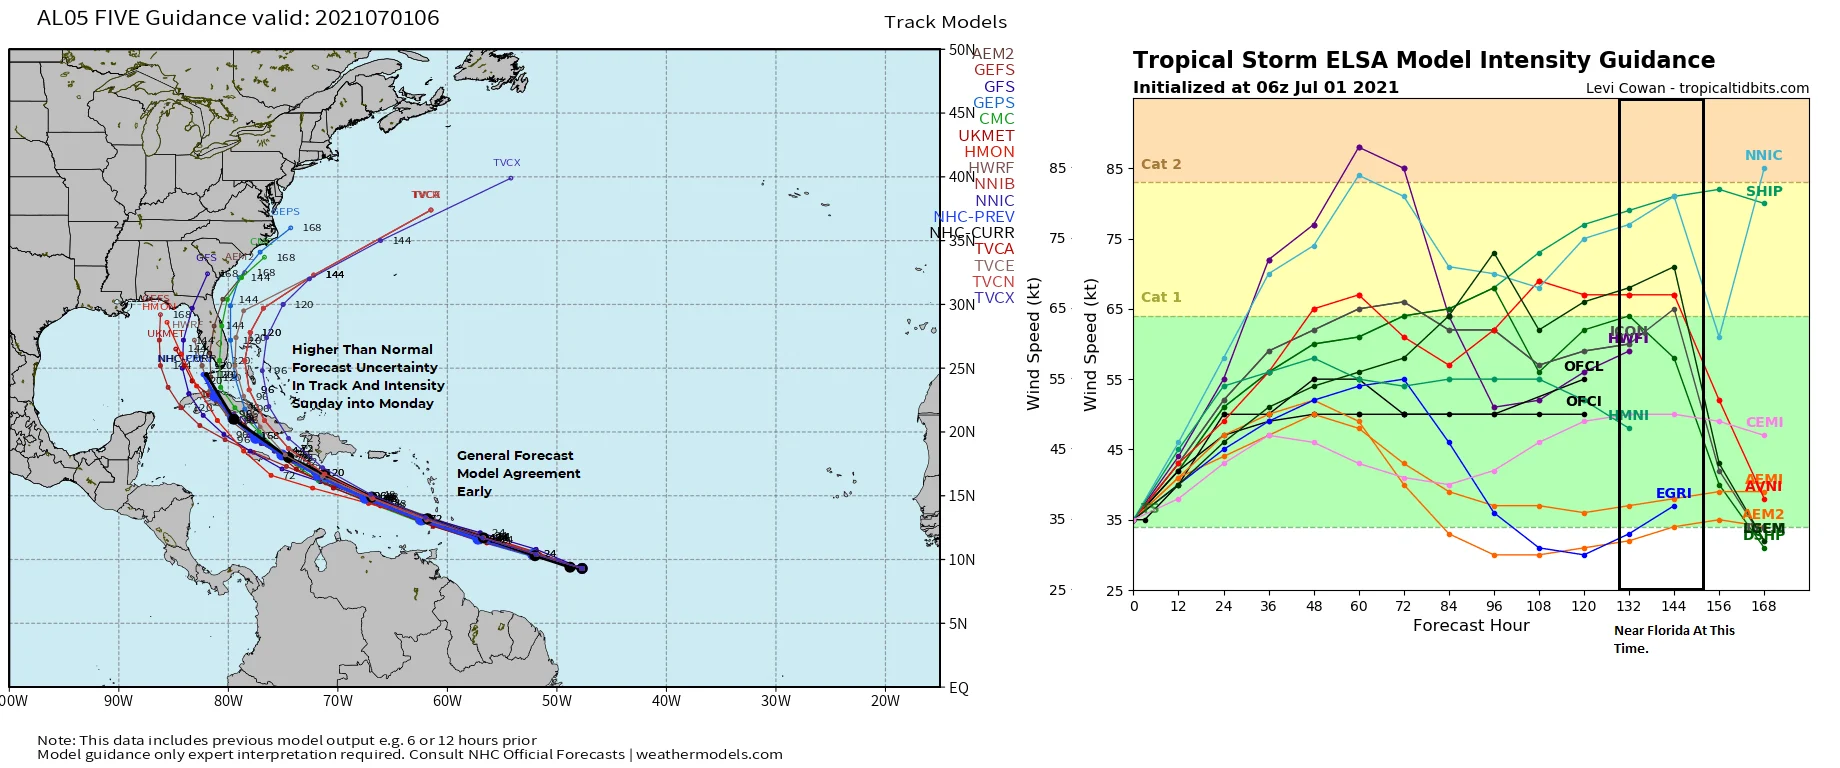
Tropical Storm Elsa, which was just upgraded this morning by the NHC, is showing more signs of organization and convection and is a little more consolidated each day. Upper-level winds are supportive for further development over the next 2-4 days. The forecast model guidance is bullish on even a weak hurricane developing as it nears the Lesser Antilles. Over the last several days the forecast model guidance has been in good agreement through 48-60 hours on the track of Elsa tracking south of Puerto Rico and Hispaniola, but beyond that, there is a lot of forecast track and intensity uncertainty. This is due to possible land interaction which will be key to the strength down the road for Elsa. Another limiting factor on intensity is by Sunday wind shear and dry air will increase in the central Caribbean and Elsa will continue to accelerate west-northwest which could continue to weaken or even dissipate by later in the weekend. Should Elsa survive in the central Caribbean, it is likely to turn north into the general vicinity of Florida or the southern Gulf. Later next week even if Elsa weakens there is a good chance it could become a more powerful storm off the northeast U.S. coastline as it interacts with a frontal system that comes off the East coast last next week. It is too early to speculate on particular scenarios, other than to say that Elsa does need to be watched in particularly insured risks across Florida for possible impacts as early as Monday night in the Florida keys if the current forecast tracks hold.
Regardless of what happens to Elsa this might be an early sign as to the type of storm tracks that could be expected during the peak of the season and matches the positive rainfall anomalies for increase rain chances in Puerto Rico and Hispaniola and Florida as seen in the seasonal climate models.
As Elsa develops, I’ll start to post more often if major insurance industry impacts are possible. At this point, it is still unknown, but there are clear signs in the long-term that the insurance industry needs to pay attention as the storm tracks seem to have a bullseye on the U.S. Coastline once again this season, or at least that is the early indication.


